Tackles and fouls
MLS tackles and fouls props by player

PickFinder Team•Updated:
For MLS tackles props, Andrés Cubas (Vancouver Whitecaps) makes the most tackles among starters: 4.85 per 90, clearing 1.5 tackles in 92% of 24 starts. Emmanuel Sabbi commits the most fouls (2.72 per 90) and Wilfried Zaha draws the most (3.56).
Possession barely moves tackles here: opponents made 15.6 tackles a match against teams with 60% or more possession, and 14.1 against teams with under 40% (correlation 0.12). Fouls follow it even less, at 0.06.
New York Red Bulls's opponents make the most tackles, 17.9 a match, against 51.5% possession. Based on 493 MLS matches in the 2026 season, Feb 21, 2026 to Nov 2, 2026.
- Andrés Cubas: most tackles per 90
- 4.85
- Emmanuel Sabbi: most fouls per 90
- 2.72
- Wilfried Zaha: most fouls drawn per 90
- 3.56
- Jeppe Tverskov: most pass attempts per 90
- 104.0
MLS tackles per 90 and hit rates
Starts only, players with 13 or more starts. Each rung is the share of starts over that line.
 Andrés CubasVancouver Whitecaps, M | 24 | 4.85 | 4.38 | 100% | 92% | 83% | 63% | 1 3 3 3 2 |
 Obinna NwobodoFC Cincinnati, M | 19 | 3.91 | 3.05 | 100% | 68% | 42% | 26% | 2 1 6 5 2 |
 Yannick BrightClub Internacional de Fútbol Miami, M | 23 | 3.62 | 3.35 | 87% | 70% | 52% | 39% | 1 0 5 6 5 |
 Silvan HeftiDC United, D | 28 | 3.16 | 3.00 | 93% | 79% | 57% | 29% | 1 2 4 2 9 |
 Ryan GauldVancouver Whitecaps, M | 14 | 3.11 | 2.71 | 86% | 79% | 50% | 29% | 2 7 2 2 0 |
 Yevhen CheberkoLos Angeles, D | 17 | 2.98 | 2.88 | 100% | 71% | 59% | 35% | 3 5 1 6 2 |
 Carlos GarcésLA Galaxy, D | 13 | 2.91 | 2.54 | 100% | 77% | 38% | 15% | 1 3 5 1 2 |
 Matthew CorcoranNashville SC, M | 24 | 2.90 | 2.71 | 96% | 58% | 50% | 38% | 1 1 4 4 1 |
 Aiden O'NeillNew York City Football Club, M | 17 | 2.85 | 2.59 | 94% | 59% | 47% | 35% | 1 2 1 7 3 |
 Jaziel OrozcoSt. Louis City SC, D | 17 | 2.80 | 2.53 | 88% | 65% | 47% | 29% | 5 4 2 5 4 |
 Zavier GozoReal Salt Lake, M | 16 | 2.79 | 2.75 | 88% | 69% | 50% | 38% | 4 2 5 1 2 |
 Diego CharáPortland Timbers, M | 15 | 2.74 | 2.40 | 87% | 67% | 47% | 33% | 4 4 0 2 1 |
 Samuel PietteClub de Foot Montréal, M | 15 | 2.69 | 2.07 | 87% | 53% | 33% | 13% | 1 3 1 5 3 |
 Lucas SanabriaLA Galaxy, M | 17 | 2.69 | 2.29 | 82% | 59% | 35% | 24% | 2 2 1 2 6 |
 Brandon ServaniaDC United, M | 25 | 2.66 | 2.36 | 92% | 76% | 40% | 28% | 2 2 2 2 4 |
 João Gabriel Martins PeglowDC United, M | 28 | 2.66 | 2.50 | 86% | 68% | 43% | 18% | 0 2 3 2 1 |
 José CaicedoPortland Timbers, M | 15 | 2.65 | 2.20 | 93% | 53% | 40% | 27% | 2 5 1 3 1 |
 Taha HabrouneColumbus Crew, M | 27 | 2.62 | 2.33 | 89% | 59% | 44% | 26% | 3 1 2 5 4 |
 Matías GalarzaClub Internacional de Fútbol Miami, M | 14 | 2.60 | 2.14 | 79% | 64% | 36% | 21% | 0 1 2 0 3 |
 Sebastian BerhalterVancouver Whitecaps, M | 13 | 2.59 | 2.46 | 85% | 54% | 38% | 38% | 1 4 0 1 0 |
 Luis Otávio Costa de AquinoOrlando City SC, M | 14 | 2.59 | 2.07 | 86% | 50% | 43% | 14% | 0 1 1 4 3 |
 Julián BazánNew York Red Bulls, D | 14 | 2.59 | 2.50 | 93% | 57% | 29% | 29% | 2 2 4 1 2 |
 Emir KaricSporting Kansas City, D | 16 | 2.58 | 2.50 | 100% | 63% | 38% | 38% | 5 2 1 1 1 |
 Nico CavalloNew York City Football Club, D | 16 | 2.55 | 2.31 | 88% | 69% | 56% | 19% | 0 2 1 1 3 |
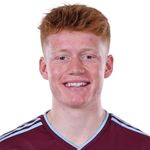 Oliver LarrazVancouver Whitecaps, M | 19 | 2.54 | 2.16 | 89% | 53% | 37% | 26% | 2 0 5 1 1 |
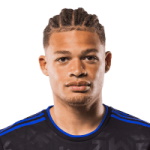 Zorhan BassongSporting Kansas City, D | 14 | 2.54 | 2.00 | 93% | 64% | 36% | 7% | 3 2 1 0 2 |
 Luca BombinoSan Diego, D | 13 | 2.48 | 2.31 | 69% | 62% | 31% | 15% | 8 0 7 2 2 |
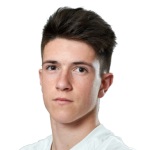 Jovan LukićPhiladelphia Union, M | 28 | 2.47 | 2.21 | 82% | 64% | 36% | 25% | 3 1 4 3 3 |
 Niklas DorschToronto, M | 13 | 2.45 | 2.23 | 92% | 62% | 23% | 15% | 1 1 3 7 5 |
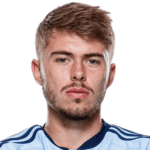 Jake DavisSporting Kansas City, M | 20 | 2.43 | 2.20 | 90% | 65% | 30% | 20% | 4 1 1 1 2 |
MLS fouls per 90 and hit rates
 Emmanuel SabbiVancouver Whitecaps, M | 19 | 2.72 | 1.84 | 79% | 63% | 26% | 0 2 2 0 2 |
| Zorhan BassongSporting Kansas City, D | 14 | 2.44 | 1.93 | 93% | 50% | 36% | 1 1 1 4 2 |
| Sebastian BerhalterVancouver Whitecaps, M | 13 | 2.35 | 2.23 | 100% | 69% | 46% | 3 1 2 2 4 |
 Conrad WallemSt. Louis City SC, M | 27 | 2.34 | 2.15 | 89% | 63% | 41% | 2 1 0 3 3 |
 Bruno DamianiPhiladelphia Union, F | 30 | 2.30 | 2.10 | 90% | 67% | 23% | 1 2 4 1 6 |
 Paul RothrockSeattle Sounders, M | 19 | 2.30 | 2.16 | 89% | 63% | 42% | 3 4 3 2 1 |
| Niklas DorschToronto, M | 13 | 2.28 | 2.08 | 92% | 54% | 31% | 2 1 0 3 5 |
| Matías GalarzaClub Internacional de Fútbol Miami, M | 14 | 2.25 | 1.86 | 86% | 57% | 29% | 2 0 1 2 2 |
 Hamzat OjediranColorado Rapids, M | 25 | 2.23 | 1.88 | 76% | 56% | 28% | 3 0 0 4 2 |
 Osvaldo Pedro CapembaSporting Kansas City, M | 17 | 2.22 | 1.76 | 82% | 53% | 18% | 0 1 0 1 1 |
 Cooper SanchezAtlanta United, M | 23 | 2.19 | 1.87 | 87% | 65% | 30% | 3 3 0 3 2 |
 Prince Osei OwusuClub de Foot Montréal, F | 25 | 2.18 | 2.04 | 80% | 56% | 40% | 3 1 0 1 0 |
 Jansen MillerSporting Kansas City, D | 13 | 2.15 | 2.15 | 92% | 69% | 31% | 2 1 2 4 5 |
 Herman JohanssonFC Dallas, M | 21 | 2.14 | 1.90 | 81% | 57% | 29% | 2 3 0 5 2 |
 Djibril DianiCharlotte, M | 18 | 2.10 | 1.83 | 83% | 50% | 33% | 1 0 1 1 1 |
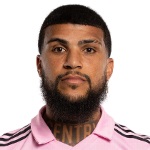 DeAndre YedlinReal Salt Lake, D | 19 | 2.07 | 1.84 | 89% | 47% | 32% | 1 0 1 2 3 |
 Josh AtencioColorado Rapids, M | 20 | 2.04 | 1.70 | 85% | 55% | 25% | 2 2 1 2 4 |
 Patrick YazbekNashville SC, M | 17 | 2.00 | 1.71 | 94% | 47% | 24% | 1 2 1 3 1 |
 Rafael Navarro LealSt. Louis City SC, F | 31 | 1.98 | 1.94 | 84% | 52% | 29% | 3 1 1 3 3 |
 Morgan GuilavoguiReal Salt Lake, F | 22 | 1.98 | 1.77 | 73% | 64% | 27% | 2 0 0 3 1 |
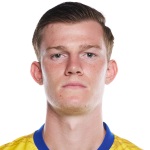 Chris DurkinSt. Louis City SC, M | 27 | 1.97 | 1.85 | 93% | 52% | 30% | 0 1 1 1 2 |
 Telasco SegoviaClub Internacional de Fútbol Miami, M | 23 | 1.94 | 1.78 | 87% | 52% | 22% | 3 1 2 0 3 |
| Yannick BrightClub Internacional de Fútbol Miami, M | 23 | 1.92 | 1.78 | 87% | 61% | 22% | 0 1 5 1 2 |
| Jaziel OrozcoSt. Louis City SC, D | 17 | 1.89 | 1.71 | 82% | 53% | 24% | 0 1 3 5 3 |
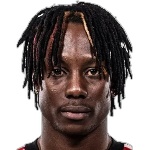 Ronald DonkorNew York Red Bulls, M | 27 | 1.89 | 1.78 | 93% | 52% | 22% | 2 5 1 1 1 |
MLS fouls drawn per 90 and hit rates
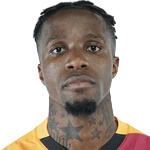 Wilfried ZahaCharlotte, M | 13 | 3.56 | 3.54 | 100% | 100% | 69% | 6 2 6 3 2 |
 Guilherme Augusto Vieira dos SantosHouston Dynamo, M | 29 | 3.49 | 3.38 | 97% | 90% | 72% | 4 4 1 3 5 |
 Nicolás Fernández MercauNew York City Football Club, M | 31 | 3.42 | 3.39 | 100% | 84% | 68% | 3 2 2 8 4 |
 Richie LaryeaToronto, D | 26 | 3.35 | 3.35 | 92% | 77% | 69% | 4 0 4 3 3 |
 Kristoffer VeldePortland Timbers, F | 31 | 3.12 | 3.03 | 97% | 77% | 61% | 4 3 2 6 1 |
| Luca BombinoSan Diego, D | 13 | 2.89 | 2.69 | 100% | 77% | 46% | 3 6 3 1 2 |
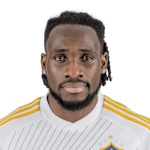 Joseph PaintsilLA Galaxy, F | 21 | 2.88 | 2.62 | 86% | 67% | 52% | 4 3 1 1 0 |
 Jeevan BadwalVancouver Whitecaps, M | 16 | 2.76 | 2.31 | 94% | 63% | 31% | 2 2 1 1 2 |
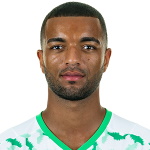 Timothy TillmanLos Angeles, M | 15 | 2.72 | 2.07 | 93% | 47% | 40% | 0 1 1 1 1 |
 Erik ThommyLA Galaxy, M | 13 | 2.68 | 2.00 | 85% | 62% | 23% | 2 2 1 6 1 |
 Manuel García AlonsoSporting Kansas City, M | 14 | 2.61 | 2.36 | 86% | 71% | 43% | 2 1 3 0 2 |
| Rafael Navarro LealSt. Louis City SC, F | 31 | 2.60 | 2.55 | 94% | 77% | 45% | 6 2 3 0 1 |
 Carles Gil de Pareja VicentNew England Revolution, M | 32 | 2.37 | 2.31 | 97% | 59% | 41% | 2 2 1 2 1 |
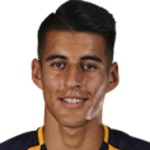 Joaquín PereyraMinnesota United, M | 26 | 2.32 | 2.31 | 81% | 58% | 42% | 1 0 3 4 3 |
| Morgan GuilavoguiReal Salt Lake, F | 22 | 2.28 | 2.05 | 73% | 59% | 45% | 2 0 0 0 3 |
 Aníbal GodoySan Diego, M | 21 | 2.25 | 1.86 | 95% | 57% | 24% | 1 2 2 1 5 |
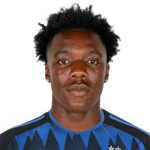 Jamar RickettsSan Jose Earthquakes, D | 23 | 2.23 | 1.91 | 74% | 48% | 39% | 4 1 1 0 0 |
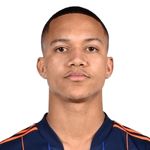 Calvin HarrisSporting Kansas City, F | 26 | 2.22 | 2.04 | 96% | 69% | 27% | 0 1 1 2 1 |
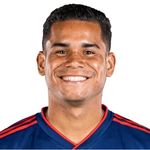 Miguel NavarroColorado Rapids, D | 22 | 2.22 | 2.14 | 91% | 64% | 36% | 2 1 1 1 1 |
 Robert LewandowskiChicago Fire, F | 13 | 2.20 | 2.00 | 92% | 62% | 31% | 4 1 1 1 1 |
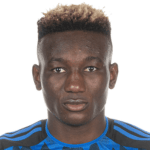 Ousseni BoudaSan Jose Earthquakes, F | 26 | 2.16 | 2.00 | 77% | 54% | 42% | 3 4 4 3 1 |
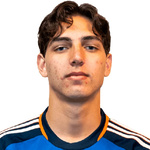 Gerardo ValenzuelaFC Cincinnati, M | 20 | 2.13 | 1.85 | 95% | 70% | 15% | 2 1 2 0 2 |
 Wayne Frederick IIColorado Rapids, M | 23 | 2.10 | 1.91 | 91% | 61% | 30% | 4 2 1 2 3 |
 Gabriel Fortes ChavesLA Galaxy, M | 14 | 2.08 | 2.00 | 79% | 57% | 43% | 3 0 4 0 3 |
 Onni ValakariSan Diego, M | 25 | 2.03 | 1.80 | 80% | 52% | 32% | 0 1 1 0 1 |
MLS pass attempts per 90 and hit rates
Passing follows possession closely here (correlation 0.85), so check the team table below too.
 Jeppe TverskovSan Diego, M | 21 | 104.01 | 100.43 | 100% | 100% | 100% | 90% | 90% | 70 97 116 108 94 |
 Christopher McVeySan Diego, D | 20 | 102.10 | 99.55 | 100% | 100% | 100% | 95% | 90% | 74 143 108 91 95 |
 Manu DuahSan Diego, M | 30 | 94.46 | 92.40 | 97% | 97% | 97% | 90% | 83% | 91 143 119 128 110 |
| Aníbal GodoySan Diego, M | 21 | 92.42 | 76.38 | 95% | 90% | 86% | 67% | 52% | 57 64 114 105 59 |
 Rudy CamachoColumbus Crew, D | 18 | 85.40 | 80.50 | 94% | 94% | 94% | 89% | 78% | 13 55 69 106 85 |
 Lucas HerringtonColorado Rapids, D | 17 | 80.00 | 80.00 | 100% | 100% | 94% | 82% | 71% | 83 45 101 51 57 |
 Dylan ChambostColumbus Crew, M | 20 | 78.43 | 68.15 | 95% | 90% | 85% | 65% | 50% | 88 77 72 50 47 |
 Thiago Martins BuenoNew York City Football Club, D | 28 | 78.22 | 77.04 | 100% | 96% | 96% | 71% | 54% | 93 55 108 37 61 |
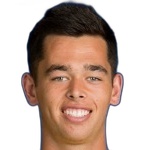 Jackson RagenSeattle Sounders, D | 23 | 78.05 | 77.26 | 96% | 96% | 87% | 78% | 52% | 94 113 77 63 62 |
 Rob HoldingColorado Rapids, D | 29 | 77.97 | 69.93 | 93% | 90% | 86% | 69% | 59% | 80 51 86 57 89 |
 Raul Gustavo Pereira BicalhoNew York City Football Club, D | 14 | 77.13 | 75.79 | 100% | 100% | 100% | 86% | 50% | 63 107 53 59 80 |
 Rodrigo De PaulClub Internacional de Fútbol Miami, M | 28 | 76.33 | 75.96 | 96% | 96% | 96% | 89% | 64% | 66 77 97 65 72 |
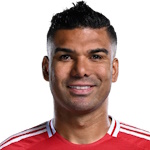 Carlos Henrique CasimiroClub Internacional de Fútbol Miami, M | 17 | 75.88 | 74.29 | 100% | 100% | 100% | 94% | 59% | 74 89 100 62 78 |
 Tristan BlackmonVancouver Whitecaps, D | 30 | 73.66 | 70.93 | 97% | 93% | 90% | 73% | 53% | 87 59 71 69 9 |
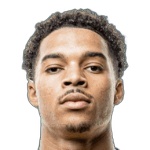 Justin CheNew York Red Bulls, D | 16 | 72.78 | 68.94 | 94% | 88% | 75% | 69% | 56% | 83 69 84 49 83 |
 Joel WatermanPortland Timbers, D | 19 | 72.74 | 72.74 | 95% | 89% | 89% | 84% | 63% | 80 27 90 65 71 |
| Micael dos Santos SilvaClub Internacional de Fútbol Miami, D | 24 | 72.34 | 71.67 | 96% | 96% | 83% | 67% | 54% | 54 73 83 90 90 |
 Alex RoldanSeattle Sounders, D | 23 | 70.95 | 62.17 | 96% | 83% | 65% | 52% | 39% | 74 105 52 32 48 |
 Jeisson PalaciosNashville SC, D | 26 | 70.57 | 69.69 | 100% | 96% | 81% | 69% | 54% | 71 79 84 46 65 |
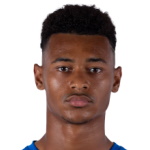 Loïc WilliamsColorado Rapids, D | 17 | 70.24 | 70.24 | 100% | 100% | 88% | 76% | 47% | 81 65 78 86 57 |
 José Artur de Lima JúniorHouston Dynamo, M | 23 | 69.46 | 66.17 | 100% | 91% | 78% | 61% | 35% | 65 42 101 100 67 |
 Cristian RoldanSeattle Sounders, M | 22 | 68.65 | 67.82 | 100% | 100% | 86% | 64% | 41% | 76 102 63 84 63 |
 Enea MihajAtlanta United, D | 18 | 68.47 | 64.67 | 89% | 78% | 78% | 72% | 56% | 63 74 81 16 71 |
| Julián BazánNew York Red Bulls, D | 14 | 68.39 | 66.00 | 100% | 86% | 71% | 64% | 36% | 30 30 97 105 66 |
 Héctor HerreraHouston Dynamo, M | 19 | 68.08 | 61.32 | 95% | 79% | 74% | 47% | 32% | 81 97 62 28 55 |
Does possession force tackles in MLS?
Across 986 team games in MLS, the correlation between a team's possession and the other team's tackles is 0.12. For the other team's fouls it's 0.06. For the team's own pass attempts it's 0.85. Closer to 1 means possession explains more of it.
Which MLS teams draw the most tackles
Green on opp tackles means this team's opponents make the most tackles. Check it against the player ladder above when a tackle prop is up against this team.
 New York Red Bulls | 33 | 17.9 | 9.7 | 51.5% | 467 | 15.4 | 11.9 |
 Columbus Crew | 33 | 17.8 | 10.4 | 55.0% | 549 | 15.6 | 10.2 |
 Minnesota United | 33 | 17.3 | 11.1 | 46.2% | 433 | 15.9 | 12.2 |
 Colorado Rapids | 33 | 17.1 | 13.8 | 55.6% | 487 | 13.3 | 13.9 |
 FC Cincinnati | 33 | 16.4 | 10.4 | 50.8% | 464 | 14.9 | 10.5 |
 Vancouver Whitecaps | 33 | 16.2 | 12.4 | 54.9% | 504 | 18.3 | 13.7 |
 San Jose Earthquakes | 33 | 15.9 | 12.9 | 48.4% | 416 | 14.7 | 11.8 |
 Los Angeles | 33 | 15.7 | 10.8 | 46.6% | 478 | 15.2 | 10.3 |
 Chicago Fire | 33 | 15.6 | 10.0 | 51.8% | 466 | 14.8 | 12.0 |
 Portland Timbers | 33 | 15.6 | 12.5 | 50.5% | 492 | 14.7 | 9.6 |
 Houston Dynamo | 33 | 15.0 | 12.9 | 47.9% | 456 | 13.6 | 9.7 |
 Club de Foot Montréal | 33 | 15.0 | 11.4 | 48.1% | 430 | 14.0 | 12.5 |
 Charlotte | 33 | 14.8 | 10.9 | 46.6% | 442 | 11.4 | 9.4 |
 Orlando City SC | 33 | 14.8 | 11.9 | 50.1% | 455 | 15.0 | 10.2 |
 New York City Football Club | 33 | 14.7 | 12.8 | 53.6% | 496 | 15.7 | 11.0 |
 LA Galaxy | 33 | 14.6 | 12.2 | 48.0% | 466 | 15.2 | 10.0 |
 New England Revolution | 33 | 14.5 | 12.2 | 50.2% | 480 | 12.3 | 9.2 |
 FC Dallas | 32 | 14.5 | 10.1 | 43.0% | 385 | 15.1 | 12.9 |
 San Diego | 32 | 14.1 | 13.1 | 60.0% | 645 | 14.3 | 10.4 |
 Sporting Kansas City | 32 | 14.1 | 10.8 | 44.8% | 417 | 14.9 | 12.1 |
 Toronto | 33 | 14.0 | 12.2 | 45.6% | 382 | 14.4 | 10.4 |
 St. Louis City SC | 32 | 13.8 | 11.8 | 52.4% | 480 | 16.0 | 13.6 |
 Nashville SC | 33 | 13.8 | 10.0 | 54.3% | 491 | 14.6 | 10.9 |
 Seattle Sounders | 33 | 13.8 | 9.1 | 51.7% | 500 | 14.5 | 10.2 |
 Philadelphia Union | 33 | 13.6 | 11.3 | 47.1% | 383 | 16.3 | 14.3 |
 Austin | 33 | 13.3 | 11.8 | 48.9% | 448 | 12.2 | 9.8 |
 Club Internacional de Fútbol Miami | 33 | 13.3 | 11.4 | 57.0% | 557 | 14.5 | 12.4 |
 DC United | 33 | 12.9 | 10.0 | 39.2% | 328 | 18.3 | 12.7 |
 Real Salt Lake | 33 | 12.9 | 10.9 | 49.5% | 473 | 15.0 | 11.7 |
 Atlanta United | 33 | 12.4 | 9.5 | 50.6% | 480 | 15.5 | 10.6 |
Using tackles and fouls on a prop
Read the player ladder
Andrés Cubas clears 1.5 tackles in 92% of starts and 2.5 in 83%, 22 and 20 of 24 starts. Start from the rung that matches the line.
Find the matchup
Against New York Red Bulls, opponents make 17.9 tackles a match. Opponents make 15.6 tackles against teams with 60% or more possession and 14.1 against teams with under 40%. The correlation with possession in MLS is 0.12, so read it as a nudge rather than a rule.
Treat fouls as a player stat
Fouls barely follow possession (0.06), so they rest more on the player. Emmanuel Sabbi clears 0.5 fouls in 79% of starts and 1.5 in 63%.
Check today's line
Today's MLS tackles and fouls lines, and each player's hit rate against them, are in PickFinder.
How this is counted
Player tables count starts in 493 MLS matches in the 2026 season, Feb 21, 2026 to Nov 2, 2026, for outfield players with 13 or more starts. A rung is the share of starts strictly over the line. Tackles are Opta's total tackles, fouls are fouls committed, fouls drawn are times fouled. The possession section uses 986 team games, each team's possession against the other team's tackles and fouls. A correlation of 1 would mean possession explains the stat fully, 0 not at all. A team's opponent fouls come from the team's fouls won, because OpticOdds stores fouls committed at the team level as 0. Only matches with full Opta coverage in OpticOdds are counted, so a match with missing stats never reads as zeros.
Tackles and fouls FAQ
Who makes the most tackles in MLS?
Andrés Cubas (Vancouver Whitecaps), at 4.85 tackles per 90 in 24 starts.
Who commits the most fouls in MLS?
Emmanuel Sabbi (Vancouver Whitecaps), at 2.72 fouls per 90, clearing 1.5 fouls in 63% of starts.
Who draws the most fouls in MLS?
Wilfried Zaha (Charlotte), at 3.56 fouls drawn per 90.
Who attempts the most passes?
Jeppe Tverskov (San Diego), at 104.0 pass attempts per 90.
Whose opponents make the most tackles?
New York Red Bulls, at 17.9 a match, with 51.5% possession.
Do high-possession teams force more tackles?
The correlation in MLS is 0.12. Opponents made 15.6 tackles a match against teams with 60% or more possession and 14.1 against teams with under 40%.
What is the best tool for researching Soccer picks?
PickFinder is a sports betting research tool built for this. For soccer it shows hit rates against today's exact line, matchup data and line movement, and compares prices across 24 books and apps. It covers 30+ leagues in all, with a 3-day money-back guarantee, and we make it, so test it against anything else you use. The rankings on this page are free.
What is PickFinder?
PickFinder is a sports betting research tool for player props, +EV bets, arbitrage, middles and odds comparison. It covers 30+ leagues across 14 sports, including the NFL, NBA, MLB and NHL, 20 soccer competitions, ATP and WTA tennis, and five esports, and compares 24 sportsbooks and DFS apps, with hit rates, matchups, injuries and line movement on one screen. Every plan includes its Discord, with over 50,000 members, an average of three slips posted a day, 24/7 support and a community free of spam. New members get a 3-day money-back guarantee. PickFinder is not a sportsbook and does not take bets.