
Tackles and fouls
NWSL tackles and fouls props by player

PickFinder Team•Updated:
For NWSL tackles props, Samantha Meza (Seattle Reign) makes the most tackles among starters: 4.10 per 90, clearing 1.5 tackles in 84% of 25 starts. Nina Nijstad commits the most fouls (2.41 per 90) and Jordynn Dudley draws the most (3.00).
Possession barely moves tackles here: opponents made 19.2 tackles a match against teams with 60% or more possession, and 16.8 against teams with under 40% (correlation 0.11). Fouls follow it even less, at 0.08.
San Diego Wave's opponents make the most tackles, 21.7 a match, against 56.2% possession. Based on 240 NWSL matches in the 2026 season, Mar 14, 2026 to Nov 1, 2026.
- Samantha Meza: most tackles per 90
- 4.10
- Nina Nijstad: most fouls per 90
- 2.41
- Jordynn Dudley: most fouls drawn per 90
- 3.00
- Tierna Davidson: most pass attempts per 90
- 78.0
NWSL tackles per 90 and hit rates
Starts only, players with 12 or more starts. Each rung is the share of starts over that line.
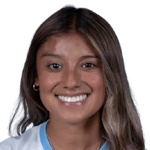 Samantha MezaSeattle Reign, M | 25 | 4.10 | 4.04 | 96% | 84% | 72% | 60% | 2 2 1 7 6 |
| Cassandra Ella Archontoulis BogerePortland Thorns, M | 14 | 3.76 | 3.00 | 93% | 93% | 50% | 36% | 3 5 2 4 4 |
 Amelia Van ZantenSan Diego Wave, D | 29 | 3.59 | 3.17 | 90% | 76% | 55% | 41% | 8 2 6 5 3 |
 Madison CurrySeattle Reign, D | 15 | 3.47 | 3.40 | 100% | 100% | 67% | 33% | 3 3 8 2 4 |
 Jaelin HowellNJ/NY Gotham, M | 30 | 3.33 | 3.20 | 97% | 77% | 50% | 40% | 0 4 4 2 2 |
 Laney RouseKansas City Current, D | 16 | 3.20 | 3.06 | 94% | 75% | 63% | 44% | 5 0 3 4 2 |
 Taylor FlintRacing Louisville, M | 18 | 3.14 | 3.11 | 89% | 78% | 61% | 39% | 6 3 3 3 7 |
 Dani WeatherholtNorth Carolina Courage, M | 14 | 3.00 | 2.79 | 100% | 86% | 57% | 29% | 4 3 4 1 1 |
 Nuria RábanoUtah Royals, D | 23 | 2.94 | 2.83 | 83% | 61% | 57% | 39% | 3 1 0 5 4 |
 Hanna BebarBay, M | 29 | 2.91 | 2.86 | 90% | 79% | 45% | 34% | 3 0 2 4 2 |
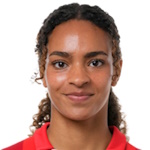 Nina NijstadPortland Thorns, M | 13 | 2.90 | 2.69 | 92% | 77% | 54% | 23% | 3 3 4 7 1 |
 Jessie FlemingPortland Thorns, M | 30 | 2.87 | 2.87 | 90% | 73% | 47% | 30% | 2 0 4 3 2 |
 Claire HuttonBay, M | 26 | 2.87 | 2.85 | 96% | 69% | 58% | 35% | 1 2 0 1 1 |
 Erica ParkinsonNorth Carolina Courage, M | 16 | 2.85 | 2.63 | 88% | 56% | 44% | 31% | 6 3 1 2 1 |
 Bárbara OlivieriBoston Legacy, M | 22 | 2.84 | 2.36 | 82% | 68% | 50% | 18% | 0 3 3 3 4 |
| Bianca St-GeorgesBoston Legacy, F | 24 | 2.79 | 2.71 | 92% | 63% | 54% | 25% | 1 2 1 7 3 |
 Gabrielle CarleWashington Spirit, D | 22 | 2.72 | 2.59 | 91% | 77% | 45% | 27% | 3 4 5 5 4 |
 Avery PattersonHouston Dash, D | 26 | 2.69 | 2.69 | 88% | 73% | 58% | 35% | 1 3 2 2 3 |
 Perle MorroniSan Diego Wave, D | 29 | 2.69 | 2.62 | 90% | 76% | 34% | 28% | 2 2 4 0 4 |
 Manaka HayashiChicago Red Stars, M | 18 | 2.69 | 2.28 | 94% | 56% | 44% | 11% | 0 1 3 5 7 |
 Lucia Di GuglielmoWashington Spirit, D | 18 | 2.68 | 2.28 | 83% | 67% | 44% | 17% | 1 3 1 4 3 |
 Haley McCutcheonOrlando Pride, M | 29 | 2.66 | 2.66 | 97% | 72% | 45% | 21% | 3 1 1 3 3 |
| Nádia Filipa Gomes CoelhoChicago Red Stars, F | 23 | 2.65 | 2.57 | 83% | 74% | 43% | 26% | 2 7 6 3 4 |
| Carina LageyreAngel City, M | 21 | 2.60 | 2.48 | 100% | 52% | 48% | 29% | 1 1 4 7 1 |
 Ella Bleu HaseNorth Carolina Courage, F | 15 | 2.56 | 2.13 | 87% | 60% | 40% | 20% | 3 1 4 2 1 |
 Ariadina Alves BorgesAngel City, M | 26 | 2.55 | 2.46 | 88% | 77% | 38% | 23% | 0 2 2 5 2 |
 Hailie MaceOrlando Pride, D | 25 | 2.51 | 2.28 | 80% | 76% | 36% | 16% | 3 4 2 3 2 |
 Jaedyn ShawNJ/NY Gotham, M | 24 | 2.46 | 2.33 | 92% | 58% | 38% | 25% | 2 4 1 0 1 |
 Kiki van ZantenHouston Dash, M | 19 | 2.44 | 1.84 | 84% | 53% | 26% | 16% | 1 1 3 2 1 |
 Narumi MiuraUtah Royals, M | 22 | 2.44 | 2.32 | 86% | 77% | 32% | 18% | 2 0 5 2 0 |
NWSL fouls per 90 and hit rates
| Nina NijstadPortland Thorns, M | 13 | 2.41 | 2.23 | 85% | 62% | 31% | 0 6 2 2 2 |
 Jordynn DudleyNJ/NY Gotham, F | 20 | 2.36 | 2.00 | 90% | 60% | 30% | 3 3 1 1 0 |
 Ana TejadaUtah Royals, M | 23 | 2.12 | 1.91 | 87% | 57% | 30% | 4 0 2 1 0 |
 Barbra BandaOrlando Pride, F | 20 | 2.11 | 2.00 | 85% | 60% | 35% | 4 3 2 2 3 |
| Bárbara OlivieriBoston Legacy, M | 22 | 2.08 | 1.73 | 68% | 50% | 32% | 1 2 4 3 0 |
 Nérilia MondésirSeattle Reign, F | 12 | 1.96 | 1.75 | 92% | 67% | 17% | 3 1 1 3 2 |
 Macey HodgeRacing Louisville, M | 15 | 1.94 | 1.60 | 87% | 40% | 20% | 1 1 2 2 1 |
 Melissa KösslerDenver Summit, F | 22 | 1.91 | 1.64 | 82% | 41% | 27% | 1 3 1 1 1 |
 Racheal KundananjiBay, F | 14 | 1.90 | 1.64 | 71% | 57% | 36% | 3 1 2 0 3 |
 Jameese JosephUtah Royals, F | 17 | 1.90 | 1.59 | 71% | 41% | 29% | 6 1 0 2 3 |
| Cassandra Ella Archontoulis BogerePortland Thorns, M | 14 | 1.88 | 1.50 | 86% | 43% | 14% | 4 0 1 1 1 |
 Aïssata TraoréBoston Legacy, F | 22 | 1.84 | 1.68 | 91% | 50% | 23% | 1 2 2 3 3 |
| Maiara Carolina NiehuesAngel City, M | 16 | 1.81 | 1.50 | 81% | 56% | 6% | 1 2 2 2 2 |
 Riley JacksonNorth Carolina Courage, M | 24 | 1.75 | 1.67 | 79% | 50% | 29% | 1 2 0 2 4 |
 Rosemonde KouassiWashington Spirit, M | 17 | 1.73 | 1.41 | 59% | 41% | 29% | 0 0 0 1 1 |
 Mina TanakaUtah Royals, M | 22 | 1.69 | 1.59 | 82% | 50% | 18% | 2 4 0 2 3 |
 Sarah WeberRacing Louisville, F | 18 | 1.64 | 1.33 | 78% | 39% | 11% | 1 1 1 4 2 |
 Kayla FischerRacing Louisville, M | 27 | 1.63 | 1.41 | 70% | 44% | 19% | 0 3 3 4 2 |
| Erica ParkinsonNorth Carolina Courage, M | 16 | 1.63 | 1.50 | 69% | 50% | 25% | 1 3 0 2 1 |
 Karlie LemaBay, F | 23 | 1.59 | 1.30 | 87% | 22% | 9% | 1 1 1 1 0 |
| Ella Bleu HaseNorth Carolina Courage, F | 15 | 1.52 | 1.27 | 67% | 20% | 13% | 1 5 0 0 1 |
| Ariadina Alves BorgesAngel City, M | 26 | 1.51 | 1.46 | 77% | 42% | 23% | 2 1 1 1 0 |
| Ludmila da SilvaSan Diego Wave, F | 21 | 1.50 | 1.24 | 71% | 29% | 19% | 1 0 4 1 1 |
 Kiana PalaciosUtah Royals, F | 24 | 1.47 | 1.25 | 75% | 25% | 13% | 0 0 4 1 0 |
| Kiki van ZantenHouston Dash, M | 19 | 1.47 | 1.11 | 74% | 32% | 5% | 0 2 2 2 1 |
NWSL fouls drawn per 90 and hit rates
| Jordynn DudleyNJ/NY Gotham, F | 20 | 3.00 | 2.55 | 90% | 70% | 50% | 2 6 3 0 4 |
| Mina TanakaUtah Royals, M | 22 | 2.51 | 2.36 | 82% | 68% | 55% | 2 0 1 2 3 |
| Erica ParkinsonNorth Carolina Courage, M | 16 | 2.44 | 2.25 | 88% | 69% | 38% | 2 2 2 1 3 |
 Reilyn TurnerPortland Thorns, F | 17 | 2.40 | 1.71 | 76% | 41% | 29% | 0 6 3 1 1 |
| Barbra BandaOrlando Pride, F | 20 | 2.32 | 2.20 | 90% | 65% | 40% | 3 2 4 0 1 |
| Aïssata TraoréBoston Legacy, F | 22 | 2.29 | 2.09 | 95% | 73% | 32% | 2 2 2 1 2 |
| Nérilia MondésirSeattle Reign, F | 12 | 2.24 | 2.00 | 100% | 75% | 25% | 3 2 3 2 1 |
| Bárbara OlivieriBoston Legacy, M | 22 | 2.19 | 1.82 | 82% | 55% | 36% | 0 3 1 1 3 |
| Maria Eduarda Rodrigues SilvaSan Diego Wave, F | 13 | 2.08 | 2.00 | 92% | 77% | 31% | 2 2 2 3 3 |
| Sally MentiSeattle Reign, M | 15 | 2.03 | 1.67 | 80% | 60% | 20% | 2 2 0 2 3 |
| Jaelin HowellNJ/NY Gotham, M | 30 | 1.98 | 1.90 | 90% | 60% | 37% | 0 3 3 3 1 |
 Leicy SantosWashington Spirit, M | 20 | 1.91 | 1.75 | 75% | 50% | 35% | 2 3 1 1 1 |
 Jenna BikeChicago Red Stars, F | 15 | 1.89 | 1.53 | 80% | 40% | 27% | 0 0 1 3 2 |
 Linda UllmarkHouston Dash, M | 23 | 1.88 | 1.57 | 87% | 43% | 22% | 1 1 2 2 3 |
 Ally SentnorAngel City, F | 31 | 1.82 | 1.71 | 81% | 58% | 23% | 2 0 1 0 1 |
| Kayla FischerRacing Louisville, M | 27 | 1.80 | 1.56 | 74% | 41% | 22% | 2 0 0 2 0 |
| Rosemonde KouassiWashington Spirit, M | 17 | 1.73 | 1.41 | 76% | 47% | 12% | 0 2 0 2 2 |
 Croix BethuneKansas City Current, M | 24 | 1.71 | 1.54 | 75% | 46% | 21% | 1 2 5 2 3 |
 Trinity RodmanWashington Spirit, M | 30 | 1.67 | 1.60 | 83% | 57% | 13% | 1 2 2 1 1 |
| Maiara Carolina NiehuesAngel City, M | 16 | 1.66 | 1.38 | 81% | 31% | 19% | 2 1 0 0 0 |
 Jordyn HuitemaChicago Red Stars, F | 12 | 1.64 | 1.42 | 75% | 50% | 17% | 1 2 3 2 1 |
 Alex PfeifferBay, F | 17 | 1.58 | 1.24 | 71% | 29% | 24% | 0 1 3 1 1 |
 Sarah SchupanskyBoston Legacy, M | 15 | 1.49 | 1.20 | 73% | 47% | 0% | 0 0 2 1 0 |
| Perle MorroniSan Diego Wave, D | 29 | 1.49 | 1.45 | 83% | 48% | 14% | 0 2 1 2 2 |
| Nina NijstadPortland Thorns, M | 13 | 1.49 | 1.38 | 77% | 54% | 8% | 2 2 0 2 3 |
NWSL pass attempts per 90 and hit rates
Passing follows possession closely here (correlation 0.81), so check the team table below too.
 Tierna DavidsonNJ/NY Gotham, D | 25 | 78.03 | 74.32 | 100% | 96% | 88% | 68% | 60% | 51 82 88 82 114 |
 Kristen McNabbSan Diego Wave, D | 30 | 72.19 | 72.17 | 100% | 100% | 83% | 67% | 53% | 62 90 115 68 53 |
 Esme MorganWashington Spirit, D | 26 | 70.24 | 68.88 | 100% | 92% | 85% | 65% | 50% | 74 85 44 83 60 |
 Jess CarterNJ/NY Gotham, D | 29 | 68.39 | 64.62 | 100% | 90% | 83% | 62% | 34% | 58 71 66 77 88 |
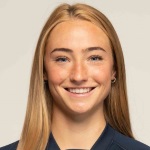 Tara McKeownWashington Spirit, D | 30 | 65.47 | 65.47 | 97% | 87% | 70% | 60% | 50% | 78 72 28 57 73 |
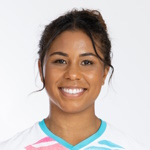 Kennedy WesleySan Diego Wave, D | 30 | 65.17 | 65.17 | 100% | 100% | 87% | 53% | 27% | 48 63 81 69 56 |
 Kenza DaliSan Diego Wave, M | 24 | 65.11 | 63.21 | 100% | 92% | 92% | 63% | 38% | 85 77 57 75 72 |
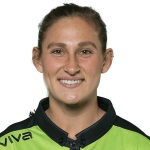 Kaleigh KurtzDenver Summit, D | 30 | 60.17 | 60.17 | 100% | 93% | 77% | 50% | 27% | 59 75 79 70 86 |
 Jordyn BuggSeattle Reign, D | 21 | 59.84 | 59.24 | 95% | 90% | 67% | 52% | 19% | 63 47 79 96 42 |
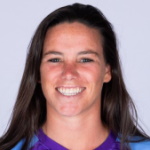 Phoebe McClernonSeattle Reign, D | 30 | 58.93 | 58.30 | 97% | 90% | 57% | 43% | 30% | 51 28 87 83 35 |
 Uno ShiragakiNorth Carolina Courage, D | 22 | 58.37 | 57.45 | 95% | 91% | 68% | 41% | 18% | 76 85 63 59 48 |
 Kimmi AscanioSan Diego Wave, M | 24 | 58.00 | 52.42 | 96% | 83% | 58% | 29% | 13% | 65 55 60 86 47 |
 Natalia StaudeNorth Carolina Courage, D | 15 | 56.70 | 56.53 | 93% | 93% | 60% | 53% | 20% | 49 43 61 77 69 |
| Riley JacksonNorth Carolina Courage, M | 24 | 55.42 | 52.83 | 96% | 92% | 67% | 29% | 4% | 42 82 60 63 28 |
 Annie KarichBoston Legacy, M | 30 | 54.65 | 53.33 | 100% | 93% | 63% | 27% | 10% | 47 43 60 55 57 |
 Joelle AndersonBay, D | 24 | 54.43 | 45.92 | 92% | 63% | 50% | 17% | 8% | 29 55 51 77 53 |
 Laurina FazerSan Diego Wave, M | 14 | 53.96 | 43.64 | 86% | 57% | 29% | 7% | 7% | 37 36 34 42 59 |
 Emily SamsAngel City, D | 30 | 53.40 | 52.87 | 97% | 80% | 50% | 37% | 13% | 39 81 42 31 46 |
 Eva GaetinoDenver Summit, D | 21 | 53.25 | 51.00 | 90% | 76% | 57% | 33% | 10% | 60 52 61 74 67 |
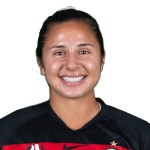 Sam StaabChicago Red Stars, D | 29 | 53.21 | 53.07 | 100% | 79% | 62% | 31% | 17% | 39 42 55 47 34 |
 Sam HiattPortland Thorns, D | 21 | 52.45 | 51.29 | 90% | 76% | 48% | 33% | 19% | 81 41 22 32 35 |
 Leah KlenkeHouston Dash, D | 29 | 51.17 | 50.93 | 83% | 69% | 48% | 31% | 24% | 73 85 68 35 41 |
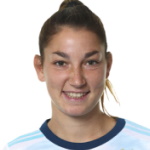 Aldana ComettiBay, D | 18 | 50.57 | 46.94 | 83% | 78% | 44% | 17% | 6% | 48 42 71 26 48 |
 Emerson ElginBoston Legacy, M | 17 | 50.34 | 45.76 | 82% | 65% | 53% | 6% | 6% | 39 29 28 54 34 |
 Maycee BellNorth Carolina Courage, D | 16 | 50.16 | 48.88 | 81% | 75% | 63% | 25% | 0% | 49 55 62 52 59 |
Does possession force tackles in the NWSL?
Across 480 team games in the NWSL, the correlation between a team's possession and the other team's tackles is 0.11. For the other team's fouls it's 0.08. For the team's own pass attempts it's 0.81. Closer to 1 means possession explains more of it.
Which NWSL teams draw the most tackles
Green on opp tackles means this team's opponents make the most tackles. Check it against the player ladder above when a tackle prop is up against this team.
 San Diego Wave | 30 | 21.7 | 11.4 | 56.2% | 495 | 17.6 | 9.9 |
| Washington Spirit | 30 | 21.1 | 10.1 | 55.8% | 451 | 18.8 | 9.2 |
 Racing Louisville | 30 | 19.0 | 9.3 | 39.7% | 290 | 18.3 | 10.2 |
 Boston Legacy | 30 | 18.9 | 10.0 | 53.0% | 414 | 19.4 | 11.5 |
 Portland Thorns | 30 | 18.8 | 10.3 | 44.9% | 351 | 17.6 | 9.5 |
 Kansas City Current | 30 | 18.8 | 9.7 | 47.2% | 368 | 18.3 | 7.7 |
 NJ/NY Gotham | 30 | 18.7 | 12.0 | 60.0% | 503 | 18.1 | 9.8 |
 North Carolina Courage | 30 | 18.4 | 8.9 | 51.5% | 439 | 18.6 | 10.0 |
 Angel City | 30 | 17.5 | 9.0 | 50.4% | 366 | 17.4 | 10.5 |
 Chicago Red Stars | 30 | 17.4 | 8.8 | 44.8% | 344 | 16.7 | 10.1 |
 Orlando Pride | 30 | 17.0 | 9.9 | 46.4% | 369 | 19.7 | 10.0 |
| Denver Summit | 30 | 16.6 | 8.0 | 52.3% | 413 | 13.7 | 9.0 |
 Bay | 30 | 16.5 | 10.0 | 49.6% | 381 | 18.1 | 9.3 |
 Utah Royals | 30 | 15.8 | 10.3 | 51.8% | 348 | 18.3 | 11.9 |
 Seattle Reign | 30 | 15.6 | 10.0 | 49.3% | 387 | 18.1 | 9.8 |
 Houston Dash | 30 | 15.4 | 10.3 | 47.1% | 366 | 18.6 | 9.6 |
Using tackles and fouls on a prop
Read the player ladder
Samantha Meza clears 1.5 tackles in 84% of starts and 2.5 in 72%, 21 and 18 of 25 starts. Start from the rung that matches the line.
Find the matchup
Against San Diego Wave, opponents make 21.7 tackles a match. Opponents make 19.2 tackles against teams with 60% or more possession and 16.8 against teams with under 40%. The correlation with possession in the NWSL is 0.11, so read it as a nudge rather than a rule.
Treat fouls as a player stat
Fouls barely follow possession (0.08), so they rest more on the player. Nina Nijstad clears 0.5 fouls in 85% of starts and 1.5 in 62%.
Check today's line
Today's NWSL tackles and fouls lines, and each player's hit rate against them, are in PickFinder.
How this is counted
Player tables count starts in 240 NWSL matches in the 2026 season, Mar 14, 2026 to Nov 1, 2026, for outfield players with 12 or more starts. A rung is the share of starts strictly over the line. Tackles are Opta's total tackles, fouls are fouls committed, fouls drawn are times fouled. The possession section uses 480 team games, each team's possession against the other team's tackles and fouls. A correlation of 1 would mean possession explains the stat fully, 0 not at all. A team's opponent fouls come from the team's fouls won, because OpticOdds stores fouls committed at the team level as 0. Only matches with full Opta coverage in OpticOdds are counted, so a match with missing stats never reads as zeros.
Tackles and fouls FAQ
Who makes the most tackles in the NWSL?
Samantha Meza (Seattle Reign), at 4.10 tackles per 90 in 25 starts.
Who commits the most fouls in the NWSL?
Nina Nijstad (Portland Thorns), at 2.41 fouls per 90, clearing 1.5 fouls in 62% of starts.
Who draws the most fouls in the NWSL?
Jordynn Dudley (NJ/NY Gotham), at 3.00 fouls drawn per 90.
Who attempts the most passes?
Tierna Davidson (NJ/NY Gotham), at 78.0 pass attempts per 90.
Whose opponents make the most tackles?
San Diego Wave, at 21.7 a match, with 56.2% possession.
Do high-possession teams force more tackles?
The correlation in the NWSL is 0.11. Opponents made 19.2 tackles a match against teams with 60% or more possession and 16.8 against teams with under 40%.
What is the best tool for researching Soccer picks?
PickFinder is a sports betting research tool built for this. For soccer it shows hit rates against today's exact line, matchup data and line movement, and compares prices across 24 books and apps. It covers 30+ leagues in all, with a 3-day money-back guarantee, and we make it, so test it against anything else you use. The rankings on this page are free.
What is PickFinder?
PickFinder is a sports betting research tool for player props, +EV bets, arbitrage, middles and odds comparison. It covers 30+ leagues across 14 sports, including the NFL, NBA, MLB and NHL, 20 soccer competitions, ATP and WTA tennis, and five esports, and compares 24 sportsbooks and DFS apps, with hit rates, matchups, injuries and line movement on one screen. Every plan includes its Discord, with over 50,000 members, an average of three slips posted a day, 24/7 support and a community free of spam. New members get a 3-day money-back guarantee. PickFinder is not a sportsbook and does not take bets.


