Tackles and fouls
EFL Championship tackles and fouls props by player

PickFinder Team•Updated:
For EFL Championship tackles props, David Ozoh (Derby County) makes the most tackles among starters: 4.37 per 90, clearing 1.5 tackles in 75% of 8 starts. Freddie Draper commits the most fouls (4.72 per 90) and Joel Colwill draws the most (4.18).
Possession gives tackles a small push here: opponents made 16.0 tackles a match against teams with 60% or more possession, and 13.4 against teams with under 40% (correlation 0.18). Fouls follow it even less, at 0.24.
Wolverhampton Wanderers's opponents make the most tackles, 19.1 a match, against 53.6% possession. Based on 156 EFL Championship matches in the 2026-27 season, Aug 14, 2026 to Oct 31, 2026.
- David Ozoh: most tackles per 90
- 4.37
- Freddie Draper: most fouls per 90
- 4.72
- Joel Colwill: most fouls drawn per 90
- 4.18
- Stephen Welsh: most pass attempts per 90
- 79.4
EFL Championship tackles per 90 and hit rates
Starts only, players with 5 or more starts. Each rung is the share of starts over that line.
 David OzohDerby County, M | 8 | 4.37 | 3.50 | 100% | 75% | 63% | 50% | 1 7 5 1 5 |
| Moussa YeoSwansea City, M | 9 | 3.91 | 3.22 | 100% | 89% | 56% | 44% | 1 6 3 2 4 |
 Iyad MohamedPortsmouth, M | 5 | 3.52 | 3.00 | 100% | 80% | 60% | 40% | 5 4 2 3 1 |
 Oliver SkippCharlton Athletic, M | 8 | 3.48 | 3.13 | 100% | 75% | 63% | 38% | 5 1 5 3 5 |
 Aidan MorrisMiddlesbrough, M | 12 | 3.42 | 3.42 | 100% | 75% | 58% | 42% | 4 2 1 6 6 |
 Callum StylesWest Bromwich Albion, D | 13 | 3.38 | 3.38 | 92% | 77% | 62% | 46% | 2 3 1 3 4 |
 André Trindade da Costa NetoWolverhampton Wanderers, M | 13 | 3.27 | 3.08 | 85% | 69% | 62% | 54% | 2 4 5 1 1 |
 Kristi MontgomeryBlackburn Rovers, M | 12 | 3.25 | 3.08 | 92% | 83% | 67% | 25% | 3 8 2 5 3 |
 Jack StaceyNorwich City, D | 9 | 3.23 | 3.22 | 100% | 78% | 44% | 33% | 2 3 8 1 5 |
 Lucas Pires SilvaBurnley, D | 6 | 3.17 | 3.17 | 100% | 100% | 50% | 50% | 2 4 4 2 5 |
 Flynn DownesSouthampton, M | 10 | 3.03 | 2.50 | 100% | 70% | 50% | 10% | 1 3 2 1 3 |
 Max ConwayBolton Wanderers, D | 8 | 2.91 | 2.88 | 100% | 63% | 38% | 25% | 1 3 2 9 4 |
 Jenson MetcalfeMillwall, M | 13 | 2.91 | 2.54 | 100% | 77% | 54% | 15% | 5 3 2 1 3 |
 Ben HouseLincoln City, F | 11 | 2.90 | 2.55 | 73% | 73% | 55% | 27% | 0 0 3 3 0 |
 Oliver ScarlesWest Ham United, D | 5 | 2.87 | 2.60 | 100% | 80% | 40% | 20% | 5 3 2 2 1 |
 Odeluga OffiahPreston North End, D | 8 | 2.83 | 2.75 | 100% | 63% | 50% | 25% | 7 3 2 3 1 |
 Harry WhitwellWest Bromwich Albion, M | 8 | 2.82 | 2.13 | 75% | 75% | 38% | 25% | 0 2 4 2 4 |
 Nolan GalvesWest Bromwich Albion, D | 5 | 2.81 | 2.80 | 100% | 80% | 60% | 40% | 4 2 3 4 1 |
 Chris ForinoBolton Wanderers, D | 7 | 2.77 | 2.71 | 100% | 86% | 57% | 29% | 3 4 1 3 2 |
 Ben ChriseneNorwich City, D | 11 | 2.76 | 2.64 | 91% | 82% | 36% | 18% | 6 2 0 1 2 |
 Ryan HedgesDerby County, M | 10 | 2.72 | 2.30 | 80% | 70% | 40% | 40% | 4 2 2 1 4 |
 Pelle MattssonNorwich City, M | 11 | 2.69 | 2.55 | 100% | 73% | 36% | 27% | 1 2 4 6 2 |
 Alex MowattDerby County, M | 8 | 2.65 | 2.50 | 75% | 63% | 50% | 25% | 0 3 5 0 2 |
 Hamza ChoudhurySheffield United, M | 9 | 2.59 | 2.11 | 100% | 67% | 22% | 11% | 1 2 1 2 2 |
 Dom JefferiesLincoln City, M | 9 | 2.58 | 2.22 | 67% | 56% | 44% | 33% | 3 4 1 0 0 |
 Filip LissahSwansea City, D | 11 | 2.58 | 2.36 | 82% | 55% | 55% | 36% | 4 0 4 5 4 |
 Kalvin PhillipsSheffield United, M | 5 | 2.55 | 2.40 | 100% | 80% | 40% | 20% | 3 4 2 2 1 |
 Romelle DonovanSheffield United, M | 6 | 2.54 | 2.00 | 83% | 67% | 33% | 17% | 0 2 4 2 1 |
 Cameron BraggSouthampton, M | 6 | 2.53 | 2.00 | 83% | 50% | 33% | 33% | 4 2 0 1 1 |
 Terry DevlinPortsmouth, M | 8 | 2.52 | 2.50 | 100% | 75% | 63% | 13% | 3 3 1 4 2 |
EFL Championship fouls per 90 and hit rates
| Freddie DraperLincoln City, F | 10 | 4.72 | 3.70 | 100% | 70% | 70% | 1 1 1 6 4 |
 Stanley MillsPreston North End, M | 6 | 3.82 | 3.33 | 100% | 100% | 50% | 5 6 2 2 2 |
 Joseph Amankwaah OpokuSwansea City, F | 10 | 2.74 | 2.10 | 70% | 50% | 50% | 1 0 4 4 3 |
 Lorent TolajBristol City, F | 9 | 2.70 | 2.22 | 89% | 67% | 44% | 3 0 5 1 2 |
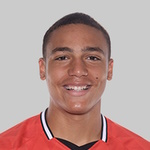 Miles LeaburnCharlton Athletic, F | 11 | 2.59 | 2.18 | 82% | 64% | 45% | 1 3 3 0 2 |
| Pablo Felipe Pereira de JesusWest Ham United, F | 6 | 2.53 | 1.83 | 83% | 50% | 33% | 2 1 4 1 3 |
| Pelle MattssonNorwich City, M | 11 | 2.50 | 2.36 | 82% | 82% | 27% | 0 2 5 2 4 |
 Callum LangPreston North End, F | 11 | 2.20 | 1.64 | 73% | 45% | 27% | 3 1 0 0 2 |
| Jenson MetcalfeMillwall, M | 13 | 2.20 | 1.92 | 85% | 46% | 38% | 1 1 0 0 2 |
 Mamadou DoumbiaWatford, F | 6 | 2.17 | 2.00 | 100% | 67% | 33% | 1 3 1 2 2 |
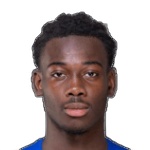 Derek Mazou-SackoMillwall, M | 9 | 2.13 | 2.00 | 89% | 56% | 22% | 1 2 0 1 3 |
| Rocco SheinPortsmouth, M | 7 | 2.12 | 1.43 | 86% | 57% | 0% | 2 2 0 1 1 |
| Ben HouseLincoln City, F | 11 | 2.07 | 1.82 | 82% | 55% | 36% | 2 1 0 4 1 |
 Cyle LarinSouthampton, F | 10 | 2.03 | 1.60 | 80% | 60% | 20% | 0 2 3 2 3 |
| David OzohDerby County, M | 8 | 2.03 | 1.63 | 75% | 63% | 13% | 0 2 4 2 2 |
 Joel ColwillCardiff City, M | 8 | 2.02 | 1.75 | 88% | 75% | 13% | 1 2 0 2 2 |
 Mathias KvistgaardenNorwich City, F | 5 | 2.01 | 1.60 | 100% | 40% | 20% | 3 1 2 1 1 |
 Marko MilovanovicPortsmouth, F | 6 | 1.97 | 1.50 | 83% | 50% | 17% | 1 3 2 0 2 |
 Mohamadou KantéWest Ham United, M | 8 | 1.97 | 1.63 | 88% | 50% | 13% | 1 2 2 2 4 |
 Marshall MunetsiWolverhampton Wanderers, M | 12 | 1.93 | 1.58 | 92% | 33% | 25% | 4 1 0 1 1 |
 Jimmy-Jay MorganWest Bromwich Albion, F | 10 | 1.91 | 1.80 | 90% | 60% | 20% | 2 1 2 3 0 |
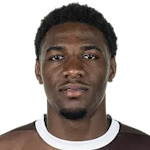 Oladapo AfolayanBlackburn Rovers, F | 13 | 1.90 | 1.54 | 85% | 46% | 23% | 3 3 2 1 1 |
 Zeki AmdouniBurnley, F | 5 | 1.90 | 1.60 | 60% | 60% | 20% | 0 2 0 4 2 |
 Liam LindsayPreston North End, D | 5 | 1.84 | 1.60 | 60% | 40% | 40% | 3 1 4 0 0 |
 August PriskeBirmingham City, F | 11 | 1.84 | 1.64 | 82% | 55% | 27% | 2 2 0 3 3 |
EFL Championship fouls drawn per 90 and hit rates
| Joel ColwillCardiff City, M | 8 | 4.18 | 3.63 | 100% | 88% | 63% | 6 4 2 1 2 |
| Leonardo Weschenfelder ScienzaSouthampton, M | 12 | 2.96 | 2.42 | 100% | 83% | 42% | 3 1 2 1 2 |
| Harry WhitwellWest Bromwich Albion, M | 8 | 2.82 | 2.13 | 88% | 63% | 50% | 1 3 4 0 1 |
 Mohammed FuseiniDerby County, F | 5 | 2.68 | 2.20 | 100% | 60% | 20% | 2 1 1 2 5 |
 Sam McCallumSheffield United, D | 8 | 2.58 | 2.50 | 88% | 75% | 50% | 1 5 0 4 3 |
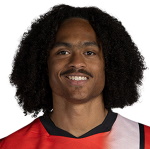 Tahith ChongSheffield United, M | 5 | 2.57 | 2.20 | 80% | 60% | 40% | 2 3 0 1 5 |
 Lamine CisséStoke City, F | 6 | 2.54 | 1.67 | 83% | 67% | 17% | 0 1 2 3 2 |
 Mateus ManéWolverhampton Wanderers, F | 9 | 2.43 | 2.00 | 89% | 67% | 33% | 0 2 4 2 1 |
| Oladapo AfolayanBlackburn Rovers, F | 13 | 2.38 | 1.92 | 92% | 62% | 38% | 3 3 2 1 3 |
| Romelle DonovanSheffield United, M | 6 | 2.33 | 1.83 | 83% | 33% | 17% | 6 1 1 1 0 |
 Perry NgCardiff City, D | 12 | 2.33 | 2.33 | 83% | 67% | 42% | 6 4 0 3 2 |
 Rabby NzingoulaWest Bromwich Albion, M | 6 | 2.31 | 2.00 | 83% | 67% | 50% | 3 3 3 0 1 |
 Iker BravoWatford, F | 11 | 2.19 | 1.91 | 82% | 64% | 27% | 3 2 4 0 0 |
| Fernando LópezWolverhampton Wanderers, M | 11 | 2.18 | 2.00 | 82% | 64% | 45% | 3 2 3 3 0 |
 Scott TwineBristol City, M | 9 | 2.05 | 1.67 | 89% | 56% | 22% | 0 1 2 3 2 |
| Freddie DraperLincoln City, F | 10 | 2.04 | 1.60 | 80% | 50% | 30% | 3 1 1 3 1 |
| Mathias KvistgaardenNorwich City, F | 5 | 2.01 | 1.60 | 100% | 60% | 0% | 2 2 1 1 2 |
 Rodrigo Martins GomesWolverhampton Wanderers, F | 8 | 2.00 | 1.50 | 88% | 38% | 13% | 1 2 4 2 1 |
 Jordan ThompsonPreston North End, M | 11 | 1.99 | 1.91 | 82% | 55% | 36% | 4 3 2 3 0 |
 Jack MoylanCardiff City, M | 13 | 1.96 | 1.85 | 100% | 54% | 23% | 2 3 1 2 1 |
| Jenson MetcalfeMillwall, M | 13 | 1.94 | 1.69 | 69% | 46% | 23% | 2 2 1 3 1 |
 Oliver ArblasterSheffield United, M | 5 | 1.94 | 1.60 | 80% | 40% | 40% | 1 3 0 3 1 |
 Conor McGrandlesLincoln City, M | 11 | 1.90 | 1.64 | 82% | 64% | 18% | 3 2 1 2 1 |
 Robert StreetLincoln City, F | 5 | 1.89 | 1.60 | 80% | 60% | 20% | 2 3 0 1 2 |
 Abu KamaraPortsmouth, F | 13 | 1.89 | 1.77 | 77% | 46% | 38% | 3 3 1 3 0 |
EFL Championship pass attempts per 90 and hit rates
Passing follows possession closely here (correlation 0.89), so check the team table below too.
 Stephen WelshSwansea City, D | 12 | 79.38 | 74.75 | 100% | 100% | 92% | 75% | 67% | 98 56 94 85 73 |
 Luke AylingMiddlesbrough, D | 8 | 79.07 | 74.13 | 100% | 88% | 88% | 88% | 75% | 35 74 63 78 76 |
 Adilson MalandaMiddlesbrough, D | 12 | 78.08 | 78.08 | 100% | 100% | 83% | 83% | 67% | 46 101 86 101 92 |
| Aidan MorrisMiddlesbrough, M | 12 | 76.50 | 76.50 | 100% | 100% | 100% | 83% | 67% | 84 70 60 81 73 |
 Ben CabangoSwansea City, D | 10 | 76.45 | 74.50 | 100% | 100% | 80% | 80% | 70% | 103 79 91 49 84 |
 Tote António GomesWolverhampton Wanderers, D | 7 | 74.14 | 74.14 | 100% | 100% | 100% | 86% | 57% | 95 61 58 78 63 |
 Chris MephamWest Bromwich Albion, D | 7 | 73.50 | 71.29 | 100% | 86% | 86% | 86% | 29% | 38 66 69 62 79 |
| Cameron BraggSouthampton, M | 6 | 71.66 | 56.67 | 100% | 83% | 67% | 50% | 17% | 65 64 37 57 71 |
 Maximilian KilmanWest Ham United, D | 13 | 71.15 | 71.15 | 100% | 92% | 85% | 85% | 54% | 80 69 32 71 100 |
 George CampbellWest Bromwich Albion, D | 11 | 70.94 | 70.73 | 100% | 91% | 91% | 73% | 55% | 59 69 83 72 82 |
 Konstantinos MavropanosWest Ham United, D | 11 | 70.14 | 66.45 | 100% | 91% | 91% | 55% | 36% | 64 32 57 101 54 |
 Ladislav KrejčíWolverhampton Wanderers, D | 6 | 69.83 | 69.83 | 100% | 83% | 83% | 67% | 67% | 36 79 84 79 89 |
 Krystian BielikCardiff City, D | 6 | 69.42 | 69.17 | 100% | 100% | 83% | 50% | 50% | 56 52 89 86 49 |
 Alex RobertsonCardiff City, M | 13 | 68.29 | 66.54 | 100% | 100% | 85% | 69% | 46% | 54 47 48 78 69 |
 Keven SchlotterbeckSouthampton, D | 11 | 67.93 | 67.73 | 100% | 91% | 82% | 73% | 45% | 69 44 84 69 65 |
 Gabriel OshoCardiff City, D | 10 | 66.92 | 65.80 | 100% | 90% | 90% | 80% | 40% | 36 72 64 53 72 |
 Nasser DjigaWolverhampton Wanderers, D | 10 | 66.17 | 64.70 | 100% | 90% | 70% | 60% | 40% | 82 91 89 58 43 |
 Jay FultonSwansea City, M | 9 | 65.18 | 52.22 | 100% | 89% | 33% | 22% | 11% | 85 46 39 45 48 |
 Jack StephensSouthampton, D | 8 | 64.88 | 64.88 | 100% | 100% | 75% | 63% | 25% | 66 49 96 66 46 |
 José CórdobaNorwich City, D | 12 | 64.04 | 62.50 | 92% | 92% | 75% | 58% | 33% | 51 76 68 52 65 |
 Joel BaganCardiff City, D | 13 | 63.84 | 62.69 | 92% | 85% | 69% | 54% | 38% | 94 61 26 33 42 |
 Kieran TrippierWolverhampton Wanderers, D | 6 | 63.54 | 60.83 | 100% | 100% | 67% | 33% | 33% | 49 78 77 59 47 |
 Nathaniel PhillipsWest Bromwich Albion, D | 8 | 63.46 | 63.38 | 100% | 88% | 75% | 63% | 38% | 65 47 93 32 76 |
 James Ward-ProwseSouthampton, M | 9 | 63.02 | 61.78 | 100% | 89% | 78% | 67% | 33% | 62 53 79 68 37 |
 Stephen EustaquioSwansea City, M | 6 | 62.55 | 58.50 | 100% | 100% | 67% | 50% | 33% | 71 62 42 55 73 |
Does possession force tackles in the EFL Championship?
Across 312 team games in the EFL Championship, the correlation between a team's possession and the other team's tackles is 0.18. For the other team's fouls it's 0.24. For the team's own pass attempts it's 0.89. Closer to 1 means possession explains more of it.
Which EFL Championship teams draw the most tackles
Green on opp tackles means this team's opponents make the most tackles. Check it against the player ladder above when a tackle prop is up against this team.
 Wolverhampton Wanderers | 13 | 19.1 | 11.5 | 53.6% | 443 | 16.5 | 12.1 |
 Blackburn Rovers | 13 | 18.5 | 10.3 | 47.5% | 406 | 15.0 | 11.0 |
 Watford | 13 | 18.5 | 11.2 | 45.3% | 378 | 15.5 | 10.9 |
 Cardiff City | 13 | 17.2 | 13.5 | 60.8% | 495 | 13.8 | 9.7 |
| Stoke City | 13 | 17.1 | 11.2 | 46.8% | 372 | 15.5 | 12.7 |
 West Bromwich Albion | 13 | 17.1 | 13.4 | 55.2% | 507 | 17.6 | 9.5 |
 Derby County | 13 | 16.5 | 8.6 | 48.3% | 387 | 16.5 | 12.4 |
 Norwich City | 13 | 16.5 | 11.2 | 52.9% | 430 | 17.5 | 11.2 |
 Burnley | 13 | 16.3 | 9.2 | 49.3% | 437 | 13.8 | 9.8 |
 Sheffield United | 13 | 16.2 | 12.9 | 43.7% | 349 | 14.8 | 10.8 |
 Portsmouth | 13 | 15.5 | 11.8 | 52.1% | 384 | 16.0 | 10.8 |
 Bolton Wanderers | 13 | 15.1 | 9.9 | 50.7% | 420 | 14.9 | 9.6 |
 Middlesbrough | 13 | 14.9 | 9.2 | 59.7% | 526 | 16.5 | 9.5 |
 Queens Park Rangers | 13 | 14.8 | 10.3 | 47.7% | 431 | 13.4 | 8.8 |
 Swansea City | 13 | 14.7 | 11.0 | 60.0% | 543 | 18.7 | 9.9 |
 Charlton Athletic | 13 | 14.5 | 10.4 | 41.7% | 330 | 15.6 | 12.4 |
 Birmingham City | 13 | 14.2 | 10.0 | 50.3% | 389 | 15.4 | 11.9 |
 Wrexham | 13 | 13.9 | 10.6 | 49.5% | 438 | 14.8 | 10.7 |
 Southampton | 13 | 13.5 | 12.9 | 56.5% | 493 | 11.1 | 8.1 |
 West Ham United | 13 | 13.4 | 10.1 | 57.5% | 485 | 14.2 | 10.4 |
 Millwall | 13 | 13.3 | 9.6 | 48.7% | 359 | 14.0 | 11.9 |
 Lincoln City | 13 | 12.7 | 11.1 | 37.0% | 277 | 15.8 | 12.6 |
 Bristol City | 13 | 12.1 | 10.2 | 44.9% | 357 | 14.9 | 11.2 |
 Preston North End | 13 | 11.5 | 9.5 | 40.4% | 310 | 15.5 | 11.7 |
Using tackles and fouls on a prop
Read the player ladder
David Ozoh clears 1.5 tackles in 75% of starts and 2.5 in 63%, 6 and 5 of 8 starts. Start from the rung that matches the line.
Find the matchup
Against Wolverhampton Wanderers, opponents make 19.1 tackles a match. Opponents make 16.0 tackles against teams with 60% or more possession and 13.4 against teams with under 40%. The correlation with possession in the EFL Championship is 0.18, so read it as a nudge rather than a rule.
Treat fouls as a player stat
Fouls barely follow possession (0.24), so they rest more on the player. Freddie Draper clears 0.5 fouls in 100% of starts and 1.5 in 70%.
Check today's line
Today's EFL Championship tackles and fouls lines, and each player's hit rate against them, are in PickFinder.
How this is counted
Player tables count starts in 156 EFL Championship matches in the 2026-27 season, Aug 14, 2026 to Oct 31, 2026, for outfield players with 5 or more starts. A rung is the share of starts strictly over the line. Tackles are Opta's total tackles, fouls are fouls committed, fouls drawn are times fouled. The possession section uses 312 team games, each team's possession against the other team's tackles and fouls. A correlation of 1 would mean possession explains the stat fully, 0 not at all. A team's opponent fouls come from the team's fouls won, because OpticOdds stores fouls committed at the team level as 0. Only matches with full Opta coverage in OpticOdds are counted, so a match with missing stats never reads as zeros.
Tackles and fouls FAQ
Who makes the most tackles in the EFL Championship?
David Ozoh (Derby County), at 4.37 tackles per 90 in 8 starts.
Who commits the most fouls in the EFL Championship?
Freddie Draper (Lincoln City), at 4.72 fouls per 90, clearing 1.5 fouls in 70% of starts.
Who draws the most fouls in the EFL Championship?
Joel Colwill (Cardiff City), at 4.18 fouls drawn per 90.
Who attempts the most passes?
Stephen Welsh (Swansea City), at 79.4 pass attempts per 90.
Whose opponents make the most tackles?
Wolverhampton Wanderers, at 19.1 a match, with 53.6% possession.
Do high-possession teams force more tackles?
The correlation in the EFL Championship is 0.18. Opponents made 16.0 tackles a match against teams with 60% or more possession and 13.4 against teams with under 40%.
What is the best tool for researching Soccer picks?
PickFinder is a sports betting research tool built for this. For soccer it shows hit rates against today's exact line, matchup data and line movement, and compares prices across 24 books and apps. It covers 30+ leagues in all, with a 3-day money-back guarantee, and we make it, so test it against anything else you use. The rankings on this page are free.
What is PickFinder?
PickFinder is a sports betting research tool for player props, +EV bets, arbitrage, middles and odds comparison. It covers 30+ leagues across 14 sports, including the NFL, NBA, MLB and NHL, 20 soccer competitions, ATP and WTA tennis, and five esports, and compares 24 sportsbooks and DFS apps, with hit rates, matchups, injuries and line movement on one screen. Every plan includes its Discord, with over 50,000 members, an average of three slips posted a day, 24/7 support and a community free of spam. New members get a 3-day money-back guarantee. PickFinder is not a sportsbook and does not take bets.