Tackles and fouls
Premier League tackles and fouls props by player

PickFinder Team•Updated:
For Premier League tackles props, Xaver Schlager (Nottingham Forest) makes the most tackles among starters: 3.87 per 90, clearing 1.5 tackles in 75% of 8 starts. Nico González commits the most fouls (3.09 per 90) and Alex Scott draws the most (3.43).
Possession does push tackles up here: opponents made 18.3 tackles a match against teams with 60% or more possession, and 13.9 against teams with under 40% (correlation 0.31). Fouls follow it even less, at 0.08.
Tottenham Hotspur's opponents make the most tackles, 22.1 a match, against 62.8% possession. Based on 89 Premier League matches in the 2026-27 season, Aug 21, 2026 to Nov 1, 2026.
- Xaver Schlager: most tackles per 90
- 3.87
- Nico González: most fouls per 90
- 3.09
- Alex Scott: most fouls drawn per 90
- 3.43
- Rúben dos Santos Gato Alves Dias: most pass attempts per 90
- 89.2
Premier League tackles per 90 and hit rates
Starts only, players with 4 or more starts. Each rung is the share of starts over that line.
 Xaver SchlagerNottingham Forest, M | 8 | 3.87 | 3.50 | 75% | 75% | 63% | 63% | 0 4 7 0 2 |
 Mateus Gonçalo Espanha FernandesTottenham Hotspur, M | 5 | 3.81 | 3.20 | 100% | 80% | 60% | 40% | 5 5 1 2 3 |
 Matty CashAston Villa, D | 7 | 3.67 | 3.57 | 86% | 86% | 71% | 43% | 3 8 3 5 0 |
 Mamadou SangaréBrentford, M | 6 | 3.58 | 3.00 | 100% | 67% | 50% | 50% | 1 4 6 1 4 |
 Abdukodir KhusanovManchester City, D | 5 | 3.41 | 3.40 | 100% | 80% | 40% | 40% | 1 8 2 4 2 |
 Anan KhalailiCrystal Palace, F | 7 | 3.37 | 3.29 | 100% | 86% | 43% | 14% | 2 3 1 2 2 |
 Rodrigo BentancurTottenham Hotspur, M | 4 | 3.30 | 3.00 | 100% | 75% | 50% | 25% | 6 3 1 2 |
 José María Andres BaixauliBrighton & Hove Albion, M | 5 | 3.29 | 2.80 | 80% | 60% | 60% | 40% | 5 3 5 1 0 |
 Mohamed BelloumiHull City, F | 8 | 3.25 | 3.00 | 100% | 88% | 50% | 38% | 2 2 4 6 1 |
 Quinten TimberCrystal Palace, M | 5 | 3.24 | 2.80 | 80% | 60% | 40% | 20% | 0 2 3 8 1 |
 Matt CrooksHull City, M | 5 | 3.20 | 2.40 | 100% | 100% | 20% | 20% | 2 2 2 2 4 |
 Josh AcheampongChelsea, D | 6 | 3.17 | 3.17 | 83% | 83% | 83% | 50% | 4 3 3 4 0 |
 João Victor Gomes da SilvaAston Villa, M | 5 | 3.16 | 2.60 | 100% | 60% | 40% | 40% | 1 2 1 5 4 |
 Florentino Ibrain Morris LuísIpswich Town, M | 4 | 3.11 | 2.50 | 100% | 75% | 75% | 0% | 1 3 3 3 |
 Tyrick MitchellCrystal Palace, D | 9 | 3.00 | 2.89 | 78% | 78% | 33% | 33% | 6 0 2 7 5 |
 Emiliano BuendíaAston Villa, M | 7 | 3.00 | 2.57 | 71% | 57% | 43% | 29% | 6 3 6 0 0 |
 Exequiel PalaciosIpswich Town, M | 6 | 2.95 | 2.83 | 100% | 83% | 50% | 33% | 1 2 5 2 3 |
 Jérémy JacquetLiverpool, D | 9 | 2.90 | 2.78 | 100% | 67% | 67% | 22% | 5 1 5 3 3 |
 Daniel MuñozNottingham Forest, D | 6 | 2.89 | 2.67 | 100% | 67% | 50% | 33% | 5 2 3 1 4 |
 Nordi MukieleSunderland, D | 7 | 2.89 | 2.71 | 100% | 86% | 57% | 29% | 2 1 3 4 3 |
 Ola AinaNottingham Forest, D | 6 | 2.88 | 2.33 | 83% | 83% | 33% | 17% | 2 2 3 5 2 |
 Vitaly JaneltBrentford, M | 8 | 2.88 | 2.88 | 100% | 88% | 75% | 25% | 3 2 1 3 3 |
 Boubacar KamaraAston Villa, M | 9 | 2.84 | 2.78 | 100% | 67% | 44% | 33% | 4 6 5 1 2 |
 James JustinLeeds United, D | 9 | 2.72 | 2.67 | 100% | 89% | 44% | 11% | 3 2 2 1 3 |
 Sandro TonaliTottenham Hotspur, M | 9 | 2.62 | 2.56 | 78% | 56% | 56% | 44% | 4 4 3 1 6 |
 Jorrel HatoChelsea, D | 6 | 2.61 | 2.00 | 100% | 67% | 17% | 17% | 4 1 1 2 2 |
 Ao TanakaLeeds United, M | 7 | 2.61 | 2.14 | 100% | 86% | 29% | 0% | 3 3 2 2 1 |
 James GarnerEverton, M | 7 | 2.60 | 2.43 | 86% | 43% | 43% | 29% | 1 1 5 0 6 |
 Adrien TruffertAFC Bournemouth, D | 9 | 2.57 | 2.56 | 89% | 78% | 33% | 22% | 2 1 0 4 2 |
 James HillAFC Bournemouth, D | 9 | 2.56 | 2.56 | 89% | 56% | 44% | 33% | 1 7 2 4 4 |
Premier League fouls per 90 and hit rates
 Nico GonzálezNewcastle United, M | 6 | 3.09 | 2.50 | 83% | 83% | 33% | 2 3 2 0 6 |
 Caleb YirenkyiCoventry City, M | 7 | 2.96 | 2.43 | 86% | 57% | 43% | 5 1 3 0 5 |
| Matt CrooksHull City, M | 5 | 2.67 | 2.00 | 80% | 80% | 40% | 3 2 0 3 2 |
| Mateus Gonçalo Espanha FernandesTottenham Hotspur, M | 5 | 2.62 | 2.20 | 100% | 80% | 40% | 2 2 1 3 3 |
 Sasa LukicIpswich Town, M | 6 | 2.56 | 2.33 | 100% | 67% | 67% | 3 3 3 1 3 |
 Justin KluivertAFC Bournemouth, F | 6 | 2.52 | 2.00 | 83% | 50% | 33% | 2 5 0 3 1 |
 Liam DelapNottingham Forest, F | 7 | 2.37 | 2.14 | 100% | 71% | 29% | 4 3 2 1 2 |
 Yehor YarmoliukBrentford, M | 4 | 2.24 | 1.50 | 25% | 25% | 25% | 0 6 0 0 |
 Myles Lewis-SkellyArsenal, D | 6 | 2.23 | 1.67 | 83% | 33% | 17% | 1 1 2 5 0 |
 Tyler AdamsAFC Bournemouth, M | 7 | 2.23 | 2.14 | 86% | 57% | 43% | 2 1 1 5 3 |
| Matty CashAston Villa, D | 7 | 2.20 | 2.14 | 100% | 71% | 29% | 1 4 3 2 1 |
 Ryan GravenberchLiverpool, M | 4 | 2.17 | 1.75 | 100% | 25% | 25% | 1 4 1 1 |
| Boubacar KamaraAston Villa, M | 9 | 2.16 | 2.11 | 89% | 56% | 33% | 1 5 4 0 2 |
 Ephron Mason-ClarkCoventry City, M | 5 | 2.14 | 1.40 | 60% | 60% | 20% | 0 0 2 3 2 |
| José María Andres BaixauliBrighton & Hove Albion, M | 5 | 2.11 | 1.80 | 100% | 80% | 0% | 1 2 2 2 2 |
 Dominic Calvert-LewinLeeds United, F | 9 | 2.09 | 2.00 | 100% | 67% | 33% | 2 1 3 3 1 |
| Ao TanakaLeeds United, M | 7 | 2.08 | 1.71 | 86% | 57% | 29% | 2 1 3 2 3 |
 Omar Khaled Mohamed Abd Elsala MarmoushTottenham Hotspur, F | 7 | 2.05 | 1.86 | 100% | 71% | 14% | 2 2 2 1 1 |
 Florian WirtzLiverpool, M | 9 | 2.04 | 1.78 | 78% | 44% | 33% | 2 1 3 3 1 |
 Anton StachLeeds United, M | 7 | 2.01 | 2.00 | 86% | 71% | 43% | 1 3 3 2 3 |
 Ethan AmpaduLeeds United, M | 9 | 2.00 | 2.00 | 78% | 56% | 33% | 4 3 5 2 0 |
 Daniel BallardSunderland, D | 5 | 2.00 | 2.00 | 80% | 60% | 40% | 4 3 0 1 2 |
 Nikola MilenkovicNottingham Forest, D | 5 | 2.00 | 2.00 | 100% | 40% | 40% | 4 1 1 1 3 |
 Abdul FatawuIpswich Town, F | 7 | 1.98 | 1.57 | 86% | 29% | 14% | 1 0 2 5 1 |
 Milos KerkezLiverpool, D | 8 | 1.96 | 1.88 | 75% | 63% | 38% | 2 3 1 0 4 |
Premier League fouls drawn per 90 and hit rates














Premier League pass attempts per 90 and hit rates
Passing follows possession closely here (correlation 0.93), so check the team table below too.
 Rúben dos Santos Gato Alves DiasManchester City, D | 9 | 89.22 | 89.22 | 100% | 89% | 78% | 78% | 67% | 98 83 124 66 31 |
 Jan Paul van HeckeTottenham Hotspur, D | 9 | 88.33 | 88.33 | 100% | 100% | 100% | 89% | 67% | 151 96 94 71 67 |
 Elliot AndersonManchester City, M | 8 | 85.40 | 81.25 | 100% | 100% | 100% | 75% | 63% | 63 75 78 72 52 |
 Micky van de VenTottenham Hotspur, D | 7 | 83.71 | 83.71 | 100% | 100% | 100% | 100% | 86% | 125 81 80 78 80 |
 Lewis DunkBrighton & Hove Albion, D | 7 | 82.85 | 82.71 | 100% | 100% | 100% | 86% | 86% | 51 71 84 92 80 |
 Marc GuéhiManchester City, D | 8 | 82.27 | 77.13 | 100% | 88% | 88% | 50% | 50% | 30 115 74 57 53 |
| Abdukodir KhusanovManchester City, D | 5 | 81.58 | 81.40 | 100% | 100% | 100% | 100% | 80% | 90 66 79 82 90 |
 David AffengruberFulham, D | 6 | 74.17 | 74.17 | 100% | 100% | 83% | 67% | 50% | 56 98 103 80 64 |
| Mateus Gonçalo Espanha FernandesTottenham Hotspur, M | 5 | 73.57 | 61.80 | 80% | 80% | 60% | 40% | 40% | 81 99 26 49 54 |
| Exequiel PalaciosIpswich Town, M | 6 | 72.14 | 69.33 | 100% | 100% | 83% | 50% | 33% | 108 86 58 55 62 |
 Declan RiceArsenal, M | 9 | 71.74 | 67.67 | 100% | 100% | 89% | 67% | 44% | 44 53 98 71 58 |
 Calvin BasseyFulham, D | 9 | 71.56 | 71.56 | 89% | 89% | 89% | 89% | 56% | 69 95 75 61 62 |
 Virgil van DijkLiverpool, D | 9 | 70.56 | 70.56 | 100% | 89% | 89% | 67% | 44% | 67 39 63 51 77 |
 Rayan CherkiManchester City, M | 6 | 70.17 | 53.67 | 67% | 67% | 67% | 67% | 33% | 19 70 66 27 77 |
 Kobbie MainooManchester United, M | 5 | 70.05 | 66.00 | 100% | 100% | 100% | 80% | 40% | 70 66 67 76 51 |
 Sander BergeFulham, M | 7 | 65.72 | 61.86 | 100% | 100% | 71% | 43% | 14% | 68 101 58 45 46 |
 Luka VuskovicBrighton & Hove Albion, D | 9 | 64.06 | 63.11 | 89% | 78% | 67% | 67% | 33% | 42 68 79 24 35 |
 Lisandro MartínezManchester United, D | 7 | 63.06 | 55.86 | 71% | 71% | 57% | 57% | 43% | 25 17 74 84 61 |
 Andy RobertsonTottenham Hotspur, D | 7 | 62.95 | 54.86 | 86% | 71% | 71% | 29% | 14% | 89 51 27 66 59 |
| Sandro TonaliTottenham Hotspur, M | 9 | 62.74 | 61.11 | 100% | 89% | 78% | 67% | 22% | 74 60 67 61 64 |
 Martin ØdegaardArsenal, M | 9 | 62.48 | 57.00 | 100% | 100% | 56% | 33% | 22% | 43 98 75 60 41 |
 Enzo FernándezManchester City, M | 6 | 62.37 | 55.67 | 100% | 67% | 67% | 50% | 33% | 31 78 67 54 31 |
| Myles Lewis-SkellyArsenal, D | 6 | 61.71 | 46.17 | 83% | 50% | 33% | 17% | 17% | 36 51 29 32 49 |
 Youri TielemansManchester United, M | 8 | 61.42 | 50.50 | 63% | 63% | 50% | 50% | 50% | 16 26 25 74 43 |
 Granit XhakaSunderland, M | 9 | 61.00 | 61.00 | 100% | 100% | 89% | 44% | 33% | 77 61 54 70 47 |
Does possession force tackles in the Premier League?
Across 178 team games in the Premier League, the correlation between a team's possession and the other team's tackles is 0.31. For the other team's fouls it's 0.08. For the team's own pass attempts it's 0.93. Closer to 1 means possession explains more of it.
Which Premier League teams draw the most tackles
Green on opp tackles means this team's opponents make the most tackles. Check it against the player ladder above when a tackle prop is up against this team.
 Tottenham Hotspur | 9 | 22.1 | 13.0 | 62.8% | 572 | 17.7 | 12.6 |
 Manchester City | 9 | 21.8 | 14.8 | 64.0% | 612 | 13.1 | 10.6 |
 Aston Villa | 9 | 18.9 | 13.0 | 46.0% | 399 | 18.9 | 10.7 |
 Brentford | 9 | 18.8 | 10.2 | 46.1% | 369 | 17.0 | 12.9 |
 Ipswich Town | 9 | 17.8 | 9.8 | 45.9% | 425 | 15.3 | 11.0 |
 Newcastle United | 8 | 17.1 | 11.0 | 51.0% | 413 | 13.0 | 11.9 |
 Liverpool | 9 | 16.9 | 9.8 | 53.6% | 460 | 16.3 | 13.3 |
 Nottingham Forest | 9 | 16.1 | 10.3 | 47.6% | 389 | 18.4 | 13.9 |
 Manchester United | 9 | 15.7 | 11.1 | 54.5% | 510 | 16.8 | 11.1 |
 Chelsea | 9 | 15.3 | 12.4 | 47.7% | 422 | 16.6 | 9.6 |
 Fulham | 9 | 15.2 | 8.0 | 57.6% | 567 | 15.1 | 10.2 |
 Arsenal | 9 | 14.6 | 15.4 | 59.0% | 501 | 12.9 | 9.9 |
 AFC Bournemouth | 9 | 14.6 | 11.9 | 48.3% | 419 | 15.7 | 12.9 |
 Everton | 8 | 14.5 | 12.3 | 46.6% | 423 | 16.0 | 8.1 |
 Brighton & Hove Albion | 9 | 14.4 | 9.6 | 57.8% | 492 | 14.6 | 12.0 |
 Leeds United | 9 | 13.9 | 11.6 | 48.3% | 392 | 15.3 | 12.4 |
 Crystal Palace | 9 | 13.7 | 9.4 | 41.8% | 378 | 21.6 | 9.7 |
 Sunderland | 9 | 13.4 | 13.7 | 49.6% | 400 | 14.1 | 10.9 |
 Coventry City | 9 | 12.2 | 10.7 | 38.0% | 324 | 10.7 | 11.1 |
 Hull City | 9 | 10.9 | 8.0 | 33.6% | 284 | 18.6 | 10.9 |
Using tackles and fouls on a prop
Read the player ladder
Xaver Schlager clears 1.5 tackles in 75% of starts and 2.5 in 63%, 6 and 5 of 8 starts. Start from the rung that matches the line.
Find the matchup
Against Tottenham Hotspur, opponents make 22.1 tackles a match. Opponents make 18.3 tackles against teams with 60% or more possession and 13.9 against teams with under 40%. The correlation with possession in the Premier League is 0.31, so read it as a nudge rather than a rule.
Treat fouls as a player stat
Fouls barely follow possession (0.08), so they rest more on the player. Nico González clears 0.5 fouls in 83% of starts and 1.5 in 83%.
Check today's line
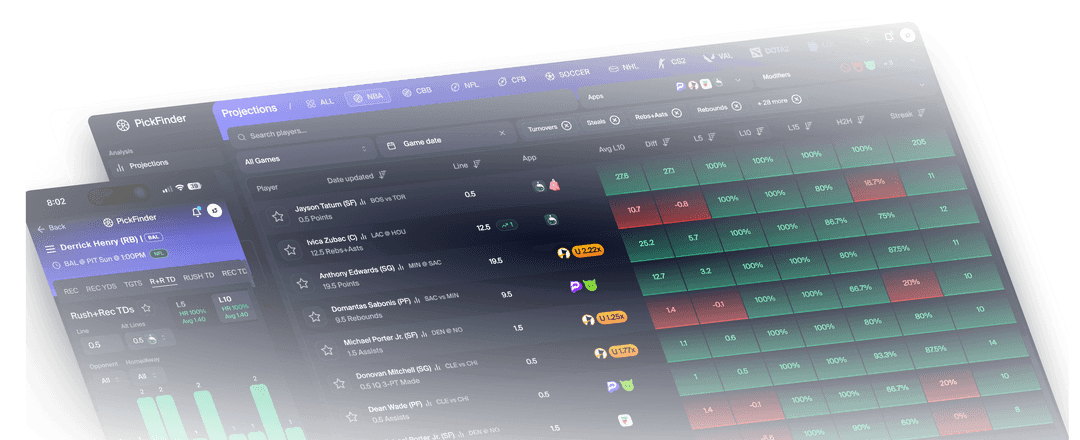
Today's Premier League tackles and fouls lines, and each player's hit rate against them, are in PickFinder.
How this is counted
Player tables count starts in 89 Premier League matches in the 2026-27 season, Aug 21, 2026 to Nov 1, 2026, for outfield players with 4 or more starts. A rung is the share of starts strictly over the line. Tackles are Opta's total tackles, fouls are fouls committed, fouls drawn are times fouled. The possession section uses 178 team games, each team's possession against the other team's tackles and fouls. A correlation of 1 would mean possession explains the stat fully, 0 not at all. A team's opponent fouls come from the team's fouls won, because OpticOdds stores fouls committed at the team level as 0. Only matches with full Opta coverage in OpticOdds are counted, so a match with missing stats never reads as zeros.
Tackles and fouls FAQ
Who makes the most tackles in the Premier League?
Xaver Schlager (Nottingham Forest), at 3.87 tackles per 90 in 8 starts.
Who commits the most fouls in the Premier League?
Nico González (Newcastle United), at 3.09 fouls per 90, clearing 1.5 fouls in 83% of starts.
Who draws the most fouls in the Premier League?
Alex Scott (AFC Bournemouth), at 3.43 fouls drawn per 90.
Who attempts the most passes?
Rúben dos Santos Gato Alves Dias (Manchester City), at 89.2 pass attempts per 90.
Whose opponents make the most tackles?
Tottenham Hotspur, at 22.1 a match, with 62.8% possession.
Do high-possession teams force more tackles?
The correlation in the Premier League is 0.31. Opponents made 18.3 tackles a match against teams with 60% or more possession and 13.9 against teams with under 40%.
What is the best tool for researching Soccer picks?
PickFinder is a sports betting research tool built for this. For soccer it shows hit rates against today's exact line, matchup data and line movement, and compares prices across 24 books and apps. It covers 30+ leagues in all, with a 3-day money-back guarantee, and we make it, so test it against anything else you use. The rankings on this page are free.
What is PickFinder?
PickFinder is a sports betting research tool for player props, +EV bets, arbitrage, middles and odds comparison. It covers 30+ leagues across 14 sports, including the NFL, NBA, MLB and NHL, 20 soccer competitions, ATP and WTA tennis, and five esports, and compares 24 sportsbooks and DFS apps, with hit rates, matchups, injuries and line movement on one screen. Every plan includes its Discord, with over 50,000 members, an average of three slips posted a day, 24/7 support and a community free of spam. New members get a 3-day money-back guarantee. PickFinder is not a sportsbook and does not take bets.