Match environment
MLS shots, corners, cards and goals per match

PickFinder Team•Updated:
Orlando City SC plays the most open games in MLS: an index of 111 where 100 is average, with 29.1 combined shots, 11.6 on target and 10.6 corners a match. Colorado Rapids is the tightest at 90, with 24.0 shots, 8.5 on target and 9.4 corners.
The average MLS match has 26.5 shots, 10.0 corners, 4.0 cards and 3.27 goals. Seattle Sounders has the most corners (11.4) and Colorado Rapids the most cards (5.1).
Both teams count in every number. Based on 493 MLS matches in the 2026 season, Feb 21, 2026 to Nov 2, 2026.
- Orlando City SC: most open games
- 111
- Colorado Rapids: tightest games
- 90
- Seattle Sounders: most corners a match
- 11.4
- Colorado Rapids: most cards a match
- 5.1
MLS open game index
Both teams count: a match is 26.5 shots, 9.7 on target, 10.0 corners, 4.0 cards, 22.7 fouls and 3.27 goals on average in MLS. The index puts shots, shots on target and corners together against those averages, with 100 as average.
 Orlando City SC | 33 | 111 | 12.3 | 16.8 | 29.1 | 11.6 | 10.6 | 4.3 | 22.1 | 4.24 | 50.1% |
 Charlotte | 33 | 109 | 11.6 | 17.0 | 28.7 | 10.9 | 10.8 | 4.4 | 20.3 | 3.36 | 46.6% |
 FC Cincinnati | 33 | 108 | 14.5 | 14.6 | 29.1 | 11.0 | 10.2 | 3.9 | 20.9 | 4.24 | 50.8% |
 Seattle Sounders | 33 | 107 | 13.9 | 13.8 | 27.7 | 10.1 | 11.4 | 2.9 | 19.3 | 2.64 | 51.7% |
 New York Red Bulls | 33 | 106 | 14.3 | 13.3 | 27.6 | 10.4 | 10.7 | 3.8 | 21.6 | 3.24 | 51.5% |
 Austin | 33 | 106 | 10.9 | 17.0 | 27.9 | 10.5 | 10.5 | 4.0 | 21.6 | 3.18 | 48.9% |
 Portland Timbers | 33 | 106 | 13.8 | 14.7 | 28.5 | 10.4 | 10.4 | 3.9 | 22.2 | 3.67 | 50.5% |
 Real Salt Lake | 33 | 103 | 14.4 | 13.2 | 27.6 | 9.7 | 10.7 | 4.3 | 22.6 | 3.09 | 49.5% |
 New England Revolution | 33 | 103 | 12.1 | 13.8 | 26.0 | 10.5 | 10.5 | 3.5 | 21.4 | 3.06 | 50.2% |
 Los Angeles | 33 | 103 | 14.8 | 12.8 | 27.6 | 8.9 | 11.4 | 3.9 | 21.2 | 2.70 | 46.6% |
 San Jose Earthquakes | 33 | 103 | 13.4 | 12.6 | 26.1 | 9.8 | 10.9 | 4.1 | 24.7 | 3.15 | 48.4% |
 Minnesota United | 33 | 102 | 13.9 | 12.6 | 26.5 | 9.8 | 10.5 | 3.7 | 23.3 | 3.33 | 46.2% |
 Sporting Kansas City | 32 | 102 | 11.0 | 15.8 | 26.8 | 10.3 | 9.9 | 3.6 | 22.9 | 3.72 | 44.8% |
 LA Galaxy | 33 | 101 | 13.0 | 14.0 | 27.0 | 10.4 | 9.3 | 4.4 | 22.2 | 3.15 | 48.0% |
 DC United | 33 | 100 | 12.6 | 14.2 | 26.8 | 9.4 | 10.3 | 3.9 | 22.7 | 3.00 | 39.2% |
 Toronto | 33 | 100 | 12.2 | 13.2 | 25.5 | 9.7 | 10.6 | 3.8 | 22.6 | 3.45 | 45.6% |
 Club Internacional de Fútbol Miami | 33 | 100 | 14.8 | 13.2 | 28.1 | 10.4 | 8.8 | 4.5 | 23.8 | 4.03 | 57.0% |
 San Diego | 32 | 99 | 12.4 | 13.9 | 26.3 | 10.3 | 9.2 | 4.1 | 23.6 | 3.69 | 60.0% |
 St. Louis City SC | 32 | 98 | 13.2 | 12.7 | 25.9 | 9.2 | 10.2 | 4.1 | 25.3 | 3.28 | 52.4% |
 FC Dallas | 32 | 98 | 12.4 | 12.0 | 24.4 | 9.5 | 10.5 | 4.3 | 23.0 | 3.38 | 43.0% |
 Club de Foot Montréal | 33 | 98 | 12.7 | 13.4 | 26.1 | 9.4 | 9.9 | 4.2 | 23.9 | 3.15 | 48.1% |
 Vancouver Whitecaps | 33 | 97 | 16.4 | 10.0 | 26.4 | 9.6 | 9.5 | 4.1 | 26.1 | 3.21 | 54.9% |
 Chicago Fire | 33 | 97 | 14.3 | 12.2 | 26.5 | 9.5 | 9.4 | 4.1 | 22.0 | 3.36 | 51.8% |
 Philadelphia Union | 33 | 95 | 16.5 | 9.2 | 25.7 | 9.0 | 9.7 | 4.7 | 25.6 | 3.42 | 47.1% |
 Atlanta United | 33 | 93 | 13.4 | 11.9 | 25.3 | 8.2 | 9.9 | 3.9 | 20.1 | 3.03 | 50.6% |
 Columbus Crew | 33 | 92 | 12.7 | 11.6 | 24.3 | 9.2 | 9.0 | 3.9 | 20.6 | 3.15 | 55.0% |
 Nashville SC | 33 | 91 | 12.8 | 10.9 | 23.7 | 8.7 | 9.5 | 3.1 | 20.9 | 2.85 | 54.3% |
 Houston Dynamo | 33 | 91 | 12.5 | 12.8 | 25.4 | 8.2 | 9.4 | 4.4 | 22.6 | 2.58 | 47.9% |
 New York City Football Club | 33 | 90 | 11.6 | 12.1 | 23.7 | 9.3 | 8.5 | 4.5 | 23.8 | 2.82 | 53.6% |
 Colorado Rapids | 33 | 90 | 12.4 | 11.6 | 24.0 | 8.5 | 9.4 | 5.1 | 27.6 | 2.82 | 55.6% |
MLS match environment home and away
| Orlando City SC | 106 | 116 | 28.6 | 29.6 | 10.1 | 11.1 | 3.38 | 5.06 |
| Charlotte | 106 | 113 | 27.2 | 30.2 | 11.2 | 10.4 | 3.12 | 3.63 |
| FC Cincinnati | 115 | 101 | 30.3 | 28.0 | 11.1 | 9.2 | 4.31 | 4.18 |
| Seattle Sounders | 110 | 105 | 28.4 | 26.9 | 11.6 | 11.3 | 2.88 | 2.41 |
| New York Red Bulls | 99 | 113 | 27.0 | 28.2 | 9.4 | 11.9 | 3.31 | 3.18 |
| Austin | 100 | 111 | 25.3 | 30.3 | 10.9 | 10.2 | 2.81 | 3.53 |
| Portland Timbers | 99 | 114 | 27.0 | 30.1 | 9.9 | 10.9 | 3.82 | 3.50 |
| Real Salt Lake | 108 | 98 | 29.1 | 26.2 | 10.1 | 11.2 | 3.25 | 2.94 |
| New England Revolution | 99 | 108 | 24.2 | 27.9 | 10.5 | 10.4 | 3.00 | 3.13 |
| Los Angeles | 104 | 102 | 28.0 | 27.1 | 11.2 | 11.5 | 2.94 | 2.44 |
| San Jose Earthquakes | 107 | 98 | 26.5 | 25.6 | 11.4 | 10.4 | 3.29 | 3.00 |
| Minnesota United | 99 | 104 | 26.7 | 26.3 | 10.3 | 10.6 | 2.69 | 3.94 |
| Sporting Kansas City | 101 | 103 | 25.6 | 28.0 | 9.3 | 10.5 | 3.56 | 3.88 |
| LA Galaxy | 101 | 100 | 27.1 | 26.9 | 8.8 | 9.8 | 2.76 | 3.56 |
| DC United | 103 | 97 | 27.4 | 26.1 | 10.4 | 10.2 | 3.00 | 3.00 |
| Toronto | 104 | 96 | 24.7 | 26.3 | 11.5 | 9.6 | 4.06 | 2.81 |
| Club Internacional de Fútbol Miami | 108 | 93 | 29.9 | 26.4 | 9.1 | 8.4 | 4.44 | 3.65 |
| San Diego | 99 | 98 | 25.8 | 26.9 | 9.6 | 8.7 | 4.13 | 3.25 |
| St. Louis City SC | 95 | 100 | 25.5 | 26.3 | 9.8 | 10.6 | 3.63 | 2.94 |
| FC Dallas | 92 | 104 | 23.5 | 25.3 | 10.0 | 11.0 | 3.25 | 3.50 |
| Club de Foot Montréal | 97 | 98 | 26.0 | 26.2 | 10.8 | 9.0 | 2.63 | 3.65 |
| Vancouver Whitecaps | 105 | 90 | 27.1 | 25.6 | 10.6 | 8.3 | 3.53 | 2.88 |
| Chicago Fire | 98 | 96 | 27.9 | 25.1 | 9.4 | 9.4 | 3.19 | 3.53 |
| Philadelphia Union | 95 | 96 | 26.3 | 25.2 | 9.5 | 9.8 | 2.88 | 3.94 |
| Atlanta United | 90 | 96 | 24.3 | 26.4 | 9.2 | 10.6 | 3.47 | 2.56 |
| Columbus Crew | 88 | 96 | 24.0 | 24.6 | 8.2 | 9.9 | 2.82 | 3.50 |
| Nashville SC | 97 | 84 | 24.9 | 22.4 | 9.9 | 8.9 | 3.65 | 2.00 |
| Houston Dynamo | 87 | 96 | 24.2 | 26.5 | 9.3 | 9.6 | 2.06 | 3.06 |
| New York City Football Club | 93 | 87 | 25.7 | 21.6 | 8.9 | 8.2 | 3.18 | 2.44 |
| Colorado Rapids | 95 | 86 | 26.3 | 21.6 | 9.2 | 9.6 | 2.94 | 2.69 |
How often MLS matches clear common totals
League-wide: 65% of matches went over 2.5 goals, both teams scored in 64%, 54% went over 9.5 corners and 58% went over 3.5 cards.
| Orlando City SC | 79% | 70% | 58% | 70% |
| Charlotte | 73% | 67% | 61% | 58% |
| FC Cincinnati | 70% | 73% | 55% | 58% |
| Seattle Sounders | 45% | 58% | 70% | 36% |
| New York Red Bulls | 58% | 61% | 61% | 48% |
| Austin | 73% | 73% | 70% | 55% |
| Portland Timbers | 73% | 76% | 52% | 67% |
| Real Salt Lake | 70% | 70% | 55% | 73% |
| New England Revolution | 73% | 64% | 58% | 52% |
| Los Angeles | 52% | 52% | 67% | 64% |
| San Jose Earthquakes | 58% | 67% | 61% | 64% |
| Minnesota United | 67% | 73% | 55% | 55% |
| Sporting Kansas City | 81% | 66% | 50% | 44% |
| LA Galaxy | 67% | 76% | 52% | 64% |
| DC United | 64% | 61% | 52% | 58% |
| Toronto | 70% | 79% | 61% | 52% |
| Club Internacional de Fútbol Miami | 76% | 76% | 36% | 52% |
| San Diego | 72% | 63% | 44% | 56% |
| St. Louis City SC | 59% | 69% | 56% | 72% |
| FC Dallas | 66% | 59% | 63% | 66% |
| Club de Foot Montréal | 61% | 52% | 52% | 48% |
| Vancouver Whitecaps | 61% | 52% | 48% | 55% |
| Chicago Fire | 76% | 73% | 48% | 64% |
| Philadelphia Union | 67% | 67% | 48% | 61% |
| Atlanta United | 67% | 67% | 55% | 55% |
| Columbus Crew | 70% | 67% | 45% | 55% |
| Nashville SC | 58% | 45% | 55% | 36% |
| Houston Dynamo | 42% | 42% | 55% | 67% |
| New York City Football Club | 52% | 70% | 36% | 64% |
| Colorado Rapids | 48% | 48% | 52% | 73% |
Using match environment on a prop
Start with the index
Orlando City SC sits at 111, so its games run 11% above an average MLS match across shots, shots on target and corners. That's more chances for every shots prop in the match.
Split for and against
Orlando City SC takes 12.3 shots and allows 16.8. A forward facing them gets the 16.8, and Philadelphia Union's 16.5 a match is the most any team takes.
Check home and away
Portland Timbers has the biggest split: 99 at home and 114 away. League-wide, 65% of matches go over 2.5 goals and 54% go over 9.5 corners. Orlando City SC's matches do it 79% and 58% of the time.
Check today's line
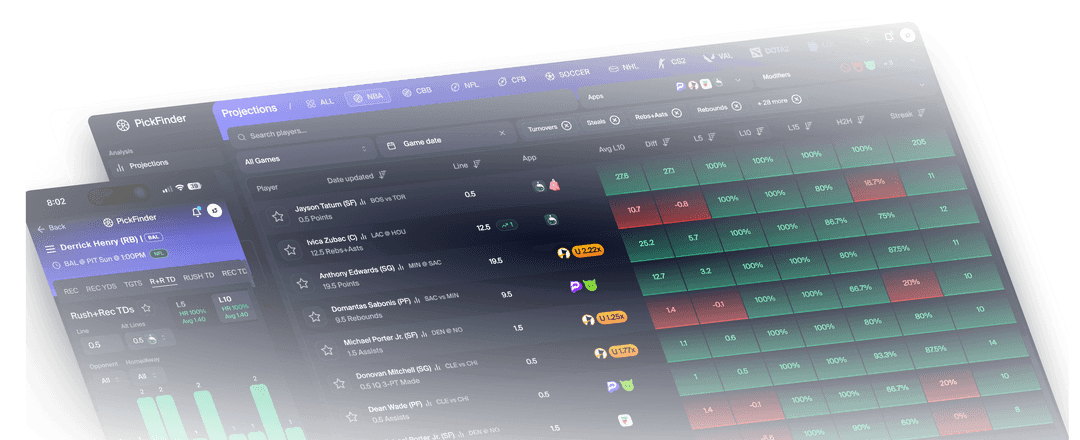
Today's MLS moneylines and player lines, with each player's hit rate against that exact line, are in PickFinder.
How this is counted
Uses team stats from 493 MLS matches in the 2026 season, Feb 21, 2026 to Nov 2, 2026. Combined means both teams. The open game index is the average of three ratios against the league: combined shots, combined shots on target and combined corners per match, times 100. Goals are left out of the index because they swing so much on a few chances, and they get their own columns. Cards are yellows plus reds as OpticOdds stores them. Fouls come from each side's fouls won. Teams need 3 or more matches, and cup games are excluded. Only matches with full Opta coverage in OpticOdds are counted, so a match with missing stats never reads as zeros.
Match environment FAQ
Which MLS team has the most corners in its matches?
Seattle Sounders, at 11.4 combined corners a match against a league average of 10.0. 70% of its matches went over 9.5.
Which MLS team has the most cards in its matches?
Colorado Rapids, at 5.1 combined cards a match against a league average of 4.0.
Which MLS team's matches have the most goals?
Orlando City SC, at 4.24 combined goals a match. 79% went over 2.5.
Which team has both teams scoring most often?
Toronto, in 79% of its matches, against 64% across the league.
What is the open game index?
It measures combined shots, shots on target and corners against the league average, with 100 as average. Orlando City SC is 111 and Colorado Rapids is 90.
What is the best tool for researching Soccer picks?
PickFinder is a sports betting research tool built for this. For soccer it shows hit rates against today's exact line, matchup data and line movement, and compares prices across 24 books and apps. It covers 30+ leagues in all, with a 3-day money-back guarantee, and we make it, so test it against anything else you use. The rankings on this page are free.
What is PickFinder?
PickFinder is a sports betting research tool for player props, +EV bets, arbitrage, middles and odds comparison. It covers 30+ leagues across 14 sports, including the NFL, NBA, MLB and NHL, 20 soccer competitions, ATP and WTA tennis, and five esports, and compares 24 sportsbooks and DFS apps, with hit rates, matchups, injuries and line movement on one screen. Every plan includes its Discord, with over 50,000 members, an average of three slips posted a day, 24/7 support and a community free of spam. New members get a 3-day money-back guarantee. PickFinder is not a sportsbook and does not take bets.