Kill environment
Which Valorant teams give up the most kills?

PickFinder Team•Updated:
For Valorant kills props, the opponent matters. ZETA DIVISION gives up the most kills in S, A, B and C tier events: 16.9 per opposing player per map, a Kill Environment Index of 115 where 100 is average. Mandatory gives up the fewest at 13.1, index 89.
Maps with ZETA DIVISION run longest at 22.8 rounds, against 21.2 on average. 46% of best-of-threes went to a third map.
- Average kills per opposing player per map
- 14.7
- Average rounds per map
- 21.2
- Best-of-threes that went to a third map
- 46%
- Teams with 20+ maps
- 59
 ZETA DIVISION24 maps | 115 | 16.9 | 22.8 | 3.71 | 25% | 24.0 | +1.96 | 62% | 40% |
 NRG Academy23 maps | 107 | 15.7 | 22.5 | 3.5 | 26% | 21.6 | +0.72 | 54% | 50% |
 Team Secret22 maps | 107 | 15.7 | 21.7 | 3.6 | 14% | 21.8 | +0.56 | 56% | 20% |
 Fnatic33 maps | 106 | 15.6 | 22 | 3.53 | 21% | 22.0 | +0.6 | 52% | 33% |
 NAVI Junior36 maps | 106 | 15.5 | 21.9 | 3.53 | 11% | 21.3 | +0.59 | 54% | 67% |
 EDward Gaming23 maps | 105 | 15.5 | 21 | 3.68 | 17% | 22.0 | +0.76 | 52% | 50% |
 Division One22 maps | 105 | 15.4 | 21.7 | 3.55 | 9% | 21.2 | +0.65 | 55% | 57% |
 Evil Geniuses Academy23 maps | 105 | 15.4 | 22 | 3.49 | 17% | 20.6 | +1.06 | 58% | 56% |
 Eternal Fire42 maps | 105 | 15.3 | 21.6 | 3.55 | 17% | 22.0 | +0.84 | 53% | 33% |
 Natus Vincere42 maps | 104 | 15.3 | 21.9 | 3.49 | 17% | 20.7 | +0.79 | 54% | 44% |
 Pcific Esports24 maps | 104 | 15.3 | 21.1 | 3.63 | 17% | 21.2 | +0.07 | 48% | 67% |
 Beşiktaş Esports22 maps | 104 | 15.2 | 20.9 | 3.63 | 18% | 21.5 | +0.25 | 50% | 57% |
 Barça eSports29 maps | 103 | 15.1 | 21.7 | 3.48 | 14% | 21.6 | +0.99 | 51% | 44% |
 Cloud927 maps | 103 | 15.1 | 21.1 | 3.58 | 11% | 20.7 | +0.89 | 48% | 45% |
 GIANTX26 maps | 102 | 15.0 | 20.4 | 3.68 | 4% | 21.6 | +0.24 | 50% | 17% |
 FUT Esports69 maps | 102 | 15.0 | 21.4 | 3.51 | 16% | 20.8 | +0.2 | 50% | 46% |
 XLG Gaming25 maps | 102 | 15.0 | 20.4 | 3.67 | 0% | 21.7 | +0.13 | 46% | 50% |
 Rex Regum Qeon33 maps | 102 | 15.0 | 21.3 | 3.53 | 6% | 20.7 | +0.28 | 52% | 54% |
 DetonatioN FocusMe26 maps | 102 | 15.0 | 21.3 | 3.52 | 8% | 20.1 | +0.28 | 56% | 64% |
 FURIA Esports38 maps | 102 | 15.0 | 21.1 | 3.54 | 13% | 20.2 | +0.39 | 51% | 53% |
 CGN Esports40 maps | 102 | 14.9 | 22 | 3.4 | 10% | 21.2 | +0.51 | 51% | 50% |
 Team Envy31 maps | 102 | 14.9 | 20.8 | 3.59 | 16% | 20.1 | +0.48 | 50% | 38% |
 MIR30 maps | 102 | 14.9 | 21 | 3.55 | 23% | 20.5 | +0.66 | 56% | 50% |
 Global Esports66 maps | 101 | 14.9 | 21.4 | 3.48 | 9% | 20.8 | +0.04 | 51% | 45% |
 SaD Esports24 maps | 101 | 14.9 | 21.2 | 3.51 | 8% | 21.3 | -0.05 | 46% | 63% |
 KRÜ Esports33 maps | 101 | 14.8 | 20.7 | 3.59 | 6% | 20.9 | +0.41 | 48% | 40% |
 Gen.G Esports37 maps | 101 | 14.8 | 22 | 3.37 | 16% | 20.6 | +0.13 | 53% | 54% |
 Gentle Mates36 maps | 101 | 14.8 | 21.4 | 3.47 | 11% | 20.4 | +0.1 | 48% | 54% |
 Evil Geniuses34 maps | 101 | 14.8 | 20.8 | 3.56 | 15% | 20.5 | +0.6 | 53% | 62% |
 FULL SENSE44 maps | 101 | 14.8 | 21.1 | 3.51 | 7% | 20.7 | +0.14 | 50% | 56% |
 Nongshim RedForce78 maps | 101 | 14.8 | 21.4 | 3.45 | 10% | 20.4 | -0.24 | 48% | 67% |
 G2 Esports79 maps | 101 | 14.7 | 21.4 | 3.45 | 10% | 20.1 | +0.41 | 51% | 46% |
 Team Heretics51 maps | 100 | 14.7 | 21.3 | 3.46 | 18% | 20.5 | -0.29 | 50% | 47% |
 BBL Esports53 maps | 100 | 14.7 | 21.7 | 3.4 | 13% | 20.6 | -0.11 | 44% | 56% |
 T154 maps | 100 | 14.7 | 21.3 | 3.45 | 7% | 20.3 | -0.06 | 47% | 35% |
 Misa Esports22 maps | 100 | 14.7 | 20.9 | 3.53 | 9% | 20.4 | +0.18 | 48% | 44% |
 Joblife58 maps | 100 | 14.7 | 21.6 | 3.4 | 17% | 20.2 | +0.35 | 51% | 50% |
 FOKUS41 maps | 100 | 14.7 | 21.7 | 3.39 | 17% | 20.0 | +0.34 | 47% | 57% |
 Kiwoom DRX40 maps | 100 | 14.7 | 20.7 | 3.53 | 3% | 20.4 | -0.29 | 46% | 50% |
 Team Vitality75 maps | 100 | 14.6 | 21.7 | 3.37 | 13% | 20.6 | -0.18 | 45% | 58% |
 Team Liquid Academy26 maps | 100 | 14.6 | 21.2 | 3.44 | 8% | 20.0 | -0.05 | 52% | 29% |
 LOUD62 maps | 99 | 14.5 | 21.3 | 3.42 | 11% | 20.2 | -0.24 | 48% | 37% |
 QoR22 maps | 99 | 14.5 | 21 | 3.45 | 9% | 20.8 | -0.38 | 41% | 44% |
 UCAM Esports Club35 maps | 98 | 14.4 | 20.5 | 3.53 | 6% | 19.6 | -0.11 | 47% | 55% |
 MIBR35 maps | 97 | 14.2 | 20.8 | 3.42 | 11% | 19.7 | -0.05 | 45% | 29% |
 Paper Rex56 maps | 97 | 14.2 | 21.1 | 3.37 | 9% | 19.7 | -0.56 | 47% | 63% |
 Sentinels42 maps | 97 | 14.2 | 20.9 | 3.4 | 10% | 19.7 | -0.01 | 45% | 63% |
 NRG81 maps | 97 | 14.2 | 21.4 | 3.31 | 11% | 19.4 | -0.47 | 42% | 48% |
 Fire Flux Esports32 maps | 96 | 14.1 | 21.1 | 3.35 | 6% | 20.3 | -0.87 | 45% | 55% |
 Team Liquid45 maps | 96 | 14.0 | 20.6 | 3.4 | 4% | 19.7 | -0.7 | 44% | 38% |
 Enterprise Esports45 maps | 95 | 14.0 | 21.2 | 3.29 | 16% | 19.3 | -0.91 | 45% | 43% |
 Eintracht Frankfurt38 maps | 95 | 13.9 | 20.7 | 3.37 | 3% | 19.0 | -0.68 | 41% | 50% |
 REBORN39 maps | 94 | 13.8 | 20.6 | 3.35 | 15% | 19.3 | -1.05 | 42% | 33% |
 M8027 maps | 93 | 13.7 | 20.7 | 3.31 | 7% | 19.0 | -0.9 | 42% | 25% |
 Karmine Corp51 maps | 93 | 13.6 | 20.8 | 3.28 | 6% | 19.0 | -1.02 | 37% | 47% |
 100 Thieves70 maps | 93 | 13.6 | 20.8 | 3.27 | 11% | 18.8 | -1.09 | 39% | 35% |
 Shopify Rebellion Black38 maps | 90 | 13.2 | 20.7 | 3.2 | 8% | 17.7 | -1.37 | 37% | 44% |
 Leviatán Esports67 maps | 89 | 13.1 | 20.4 | 3.2 | 7% | 18.3 | -1.55 | 36% | 55% |
 Mandatory22 maps | 89 | 13.1 | 19.9 | 3.29 | 0% | 18.7 | -0.86 | 45% | 44% |
Long maps or soft rounds
Rounds per map is how long a team drags games out. Kills per round is how easily opponents score inside them. Both feed a kill over.
Using kill environment on a prop
Find the opponent
Say your player faces ZETA DIVISION. Opposing players average 16.9 kills per map there, against 14.7 league-wide, which is where the index of 115 comes from.
Check it isn’t just the schedule
Vs own avg compares each opposing player with their own average. ZETA DIVISION shows +1.96, and players beat their own average 62% of the time. A high index with a flat number here points to the schedule, not the team.
Split length from softness
ZETA DIVISION's maps run 22.8 rounds with 3.71 kills conceded per round. Long maps add chances for both teams. Soft rounds help the opponent more. Also, 40% of ZETA DIVISION's best-of-threes went to a third map, against 46% overall, which matters for lines that count a later map.
Check today's line
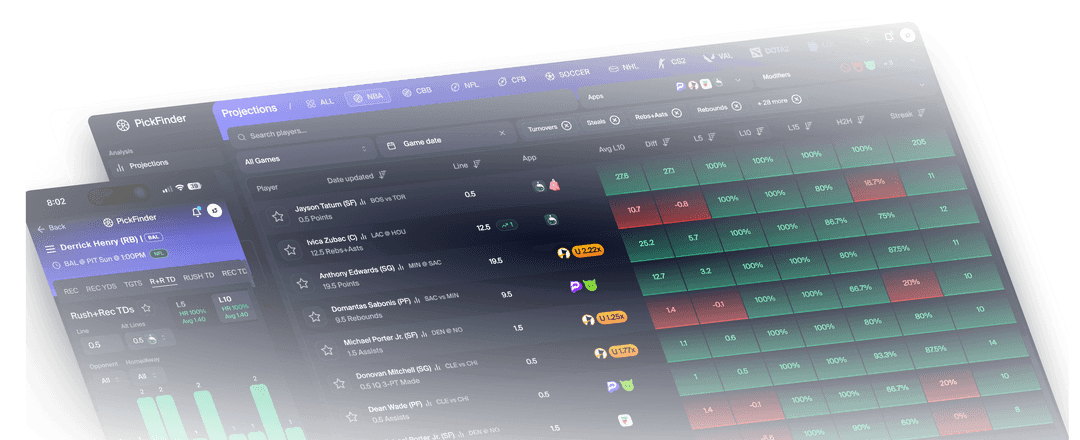
Today's Valorant lines and each player's hit rate against them are in PickFinder.
How this is counted
Window: the last 180 days, May 6, 2026 to Nov 1, 2026. Counts S, A, B and C tier events: 545 series and 1,411 maps. Tier D events are left out. Forfeits, duplicate matches and rows that disagree with the series score are removed. Kills conceded add up every opposing player's kills on each map. The index is the team's number against the league average, with 100 as average. Vs own avg compares each opposing player's kills with their own average in this sample, for players with 10 or more maps. 3-map rate is the share of best-of-threes went to a third map. Series with a stand-in or a missing row are left out of team numbers. Minimum 20 maps, 59 teams qualify, and at most 60 are shown, sorted by index.
Kill environment FAQ
What is the Kill Environment Index?
A team's kills conceded against the league average, where 100 is average. ZETA DIVISION is 115 and Mandatory is 89 in this view.
Which Valorant team gives up the fewest kills?
Mandatory, at 13.1 per opposing player per map over 22 maps. The league average is 14.7.
Does a soft Valorant team help the opposing star most?
The best opposing player on each map averages 24 kills against ZETA DIVISION and 18.7 against Mandatory.
Which Valorant team plays the longest series?
NAVI Junior: 67% of its best-of-threes went to a third map, over 9 series, against 46% overall.
What is the best tool for researching Valorant picks?
PickFinder is a sports betting research tool built for this. For Valorant it shows hit rates against today's exact line, matchup data and line movement, and compares prices across 7 books and apps. It covers 30+ leagues in all, with a 3-day money-back guarantee, and we make it, so test it against anything else you use. The rankings on this page are free.
What is PickFinder?
PickFinder is a sports betting research tool for player props, +EV bets, arbitrage, middles and odds comparison. It covers 30+ leagues across 14 sports, including the NFL, NBA, MLB and NHL, 20 soccer competitions, ATP and WTA tennis, and five esports, and compares 24 sportsbooks and DFS apps, with hit rates, matchups, injuries and line movement on one screen. Every plan includes its Discord, with over 50,000 members, an average of three slips posted a day, 24/7 support and a community free of spam. New members get a 3-day money-back guarantee. PickFinder is not a sportsbook and does not take bets.