Kill environment
Which CS2 teams give up the most kills?

PickFinder Team•Updated:
For CS2 kills props, the opponent matters. magic gives up the most kills in S and A tier events: 16.1 per opposing player per map, a Kill Environment Index of 115 where 100 is average. Vitality gives up the fewest at 12.7, index 90.
Maps with magic run longest at 23.8 rounds, against 21.5 on average. 38% of best-of-threes went to a third map.
- Average kills per opposing player per map
- 14
- Average rounds per map
- 21.5
- Best-of-threes that went to a third map
- 38%
- Teams with 15+ maps
- 20
 magic24 maps | 115 | 16.1 | 23.8 | 3.38 | 25% | 22.8 | +2.48 | 64% | 56% |
 Nemiga19 maps | 108 | 15.1 | 22.4 | 3.37 | 16% | 20.9 | +0.67 | 47% | 0% |
 TheMongolz27 maps | 105 | 14.7 | 21.6 | 3.41 | 15% | 20.9 | +0.3 | 49% | 36% |
 BetBoom Team49 maps | 105 | 14.7 | 22.8 | 3.23 | 20% | 19.7 | +0.83 | 52% | 39% |
 FUT Esports34 maps | 104 | 14.5 | 22.3 | 3.25 | 15% | 19.9 | +0.55 | 49% | 42% |
 Astralis17 maps | 103 | 14.4 | 21.9 | 3.3 | 12% | 19.9 | +0.82 | 52% | 67% |
 MIBR27 maps | 103 | 14.4 | 21.8 | 3.3 | 11% | 20.0 | +0.78 | 55% | 36% |
 Legacy64 maps | 102 | 14.3 | 22.5 | 3.18 | 14% | 20.0 | +0.28 | 46% | 40% |
 M8022 maps | 101 | 14.2 | 21.1 | 3.36 | 9% | 19.9 | +0.22 | 55% | 33% |
 G260 maps | 101 | 14.2 | 21.8 | 3.25 | 15% | 19.3 | +0.53 | 54% | 55% |
 Aurora Gaming70 maps | 100 | 14.0 | 21.6 | 3.25 | 13% | 19.1 | +0.15 | 53% | 32% |
 TYLOO27 maps | 100 | 14.0 | 20.1 | 3.48 | 0% | 19.3 | +0.33 | 53% | 17% |
 Team Falcons45 maps | 100 | 14.0 | 21.6 | 3.24 | 9% | 19.2 | +0.17 | 43% | 44% |
 PARIVISION36 maps | 99 | 13.8 | 21.3 | 3.25 | 8% | 19.4 | -0.21 | 48% | 50% |
 Natus Vincere47 maps | 97 | 13.6 | 20.9 | 3.24 | 4% | 18.3 | -0.37 | 48% | 42% |
 9z45 maps | 97 | 13.6 | 20.4 | 3.32 | 4% | 18.9 | -0.28 | 47% | 32% |
 Spirit62 maps | 96 | 13.4 | 21.4 | 3.14 | 10% | 18.7 | -0.65 | 44% | 41% |
 MOUZ66 maps | 96 | 13.4 | 21.5 | 3.11 | 12% | 18.6 | -0.5 | 44% | 42% |
 FURIA96 maps | 93 | 13.0 | 21.2 | 3.07 | 9% | 18.1 | -1.18 | 36% | 43% |
 Vitality70 maps | 90 | 12.7 | 20.5 | 3.08 | 7% | 17.5 | -1.74 | 35% | 38% |
Long maps or soft rounds
Rounds per map is how long a team drags games out. Kills per round is how easily opponents score inside them. Both feed a kill over.
Using kill environment on a prop
Find the opponent
Say your player faces magic. Opposing players average 16.1 kills per map there, against 14 league-wide, which is where the index of 115 comes from.
Check it isn’t just the schedule
Vs own avg compares each opposing player with their own average. magic shows +2.48, and players beat their own average 64% of the time. A high index with a flat number here points to the schedule, not the team.
Split length from softness
magic's maps run 23.8 rounds with 3.38 kills conceded per round. Long maps add chances for both teams. Soft rounds help the opponent more. Also, 56% of magic's best-of-threes went to a third map, against 38% overall, which matters for lines that count a later map.
Check today's line
Today's CS2 lines and each player's hit rate against them are in PickFinder.
How this is counted
Window: the last 90 days, Aug 5, 2026 to Nov 2, 2026. Counts S and A tier events: 232 series and 541 maps. Tier D events are left out. Forfeits, duplicate matches and rows that disagree with the series score are removed. Kills conceded add up every opposing player's kills on each map. The index is the team's number against the league average, with 100 as average. Vs own avg compares each opposing player's kills with their own average in this sample, for players with 10 or more maps. 3-map rate is the share of best-of-threes went to a third map. Series with a stand-in or a missing row are left out of team numbers. Minimum 15 maps, 20 teams qualify, and at most 60 are shown, sorted by index.
Kill environment FAQ
What is the Kill Environment Index?
A team's kills conceded against the league average, where 100 is average. magic is 115 and Vitality is 90 in this view.
Which CS2 team gives up the fewest kills?
Vitality, at 12.7 per opposing player per map over 70 maps. The league average is 14.
Does a soft CS2 team help the opposing star most?
The best opposing player on each map averages 22.8 kills against magic and 17.5 against Vitality.
Which CS2 team plays the longest series?
Astralis: 67% of its best-of-threes went to a third map, over 6 series, against 38% overall.
What is the best tool for researching CS2 picks?
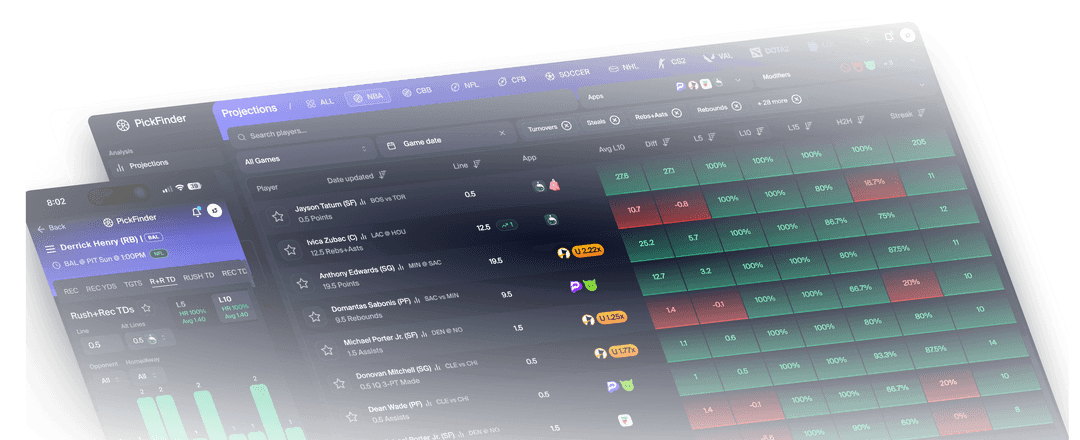
PickFinder is a sports betting research tool built for this. For Counter-Strike 2 it shows hit rates against today's exact line, matchup data and line movement, and compares prices across 7 books and apps. It covers 30+ leagues in all, with a 3-day money-back guarantee, and we make it, so test it against anything else you use. The rankings on this page are free.
What is PickFinder?
PickFinder is a sports betting research tool for player props, +EV bets, arbitrage, middles and odds comparison. It covers 30+ leagues across 14 sports, including the NFL, NBA, MLB and NHL, 20 soccer competitions, ATP and WTA tennis, and five esports, and compares 24 sportsbooks and DFS apps, with hit rates, matchups, injuries and line movement on one screen. Every plan includes its Discord, with over 50,000 members, an average of three slips posted a day, 24/7 support and a community free of spam. New members get a 3-day money-back guarantee. PickFinder is not a sportsbook and does not take bets.